End users who sign in to the threatER Portal will first see Reports on the landing page. Reports provides a quick, graphical look at your system summaries and contain only metadata summarized from the detailed logs stored in Enforce. There shouldn't be compliance issues with the data contained within the cloud platform, as no specific data is contained within the Portal
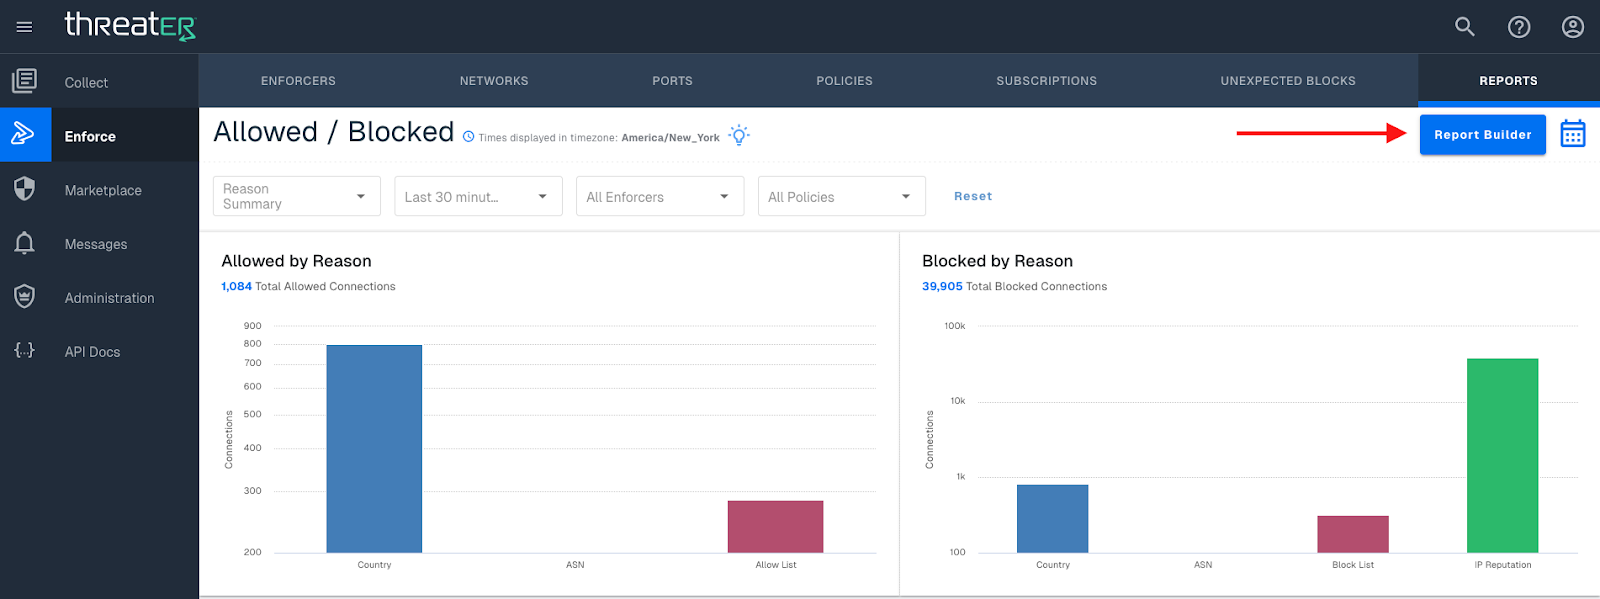
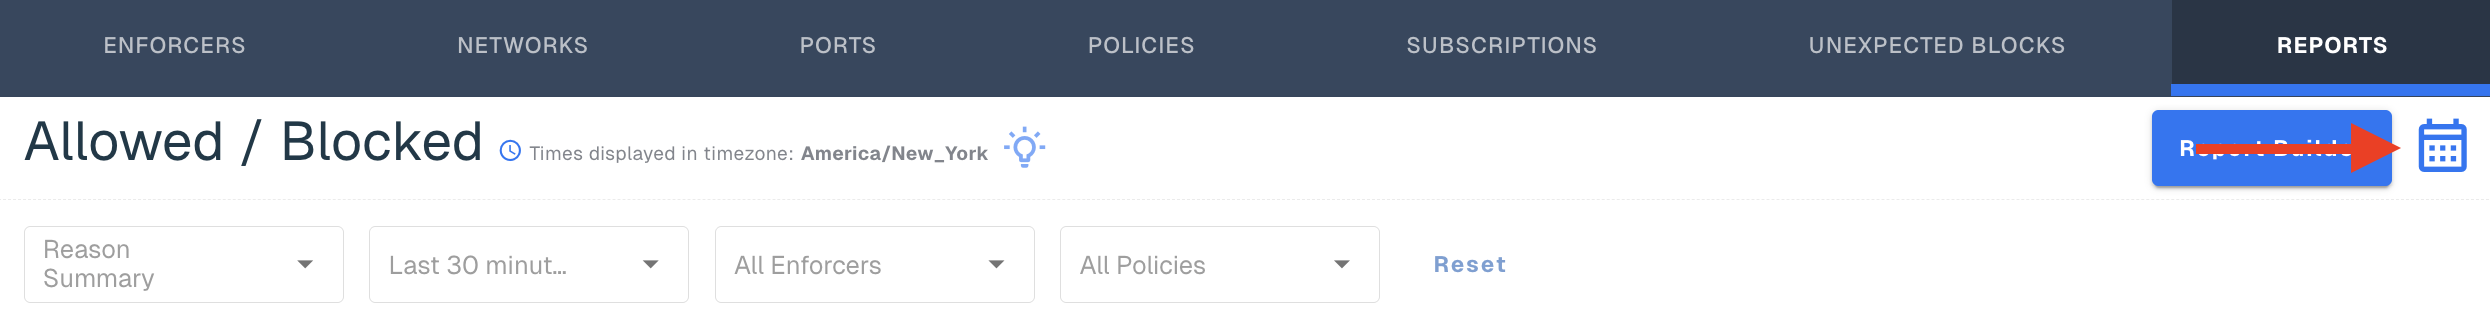
Select Enforce > Reports to access the Reports tab. The Allowed / Blocked: Reason Summary report is the default view. There are two types of reports, Allowed / Blocked & Top 10, and each one has the functionality to schedule a report. All data in reports is displayed in your browser's local time zone.
Allowed / Blocked
There are four options that display information on allowed or blocked policies. The reports tab defaults to showing all connections made in the last 30 minutes on all policies and Enforcers. This data can be filtered based on various preset or custom timeframes, on a per-policy basis, or on a per-Enforcer basis.
Reason Summary
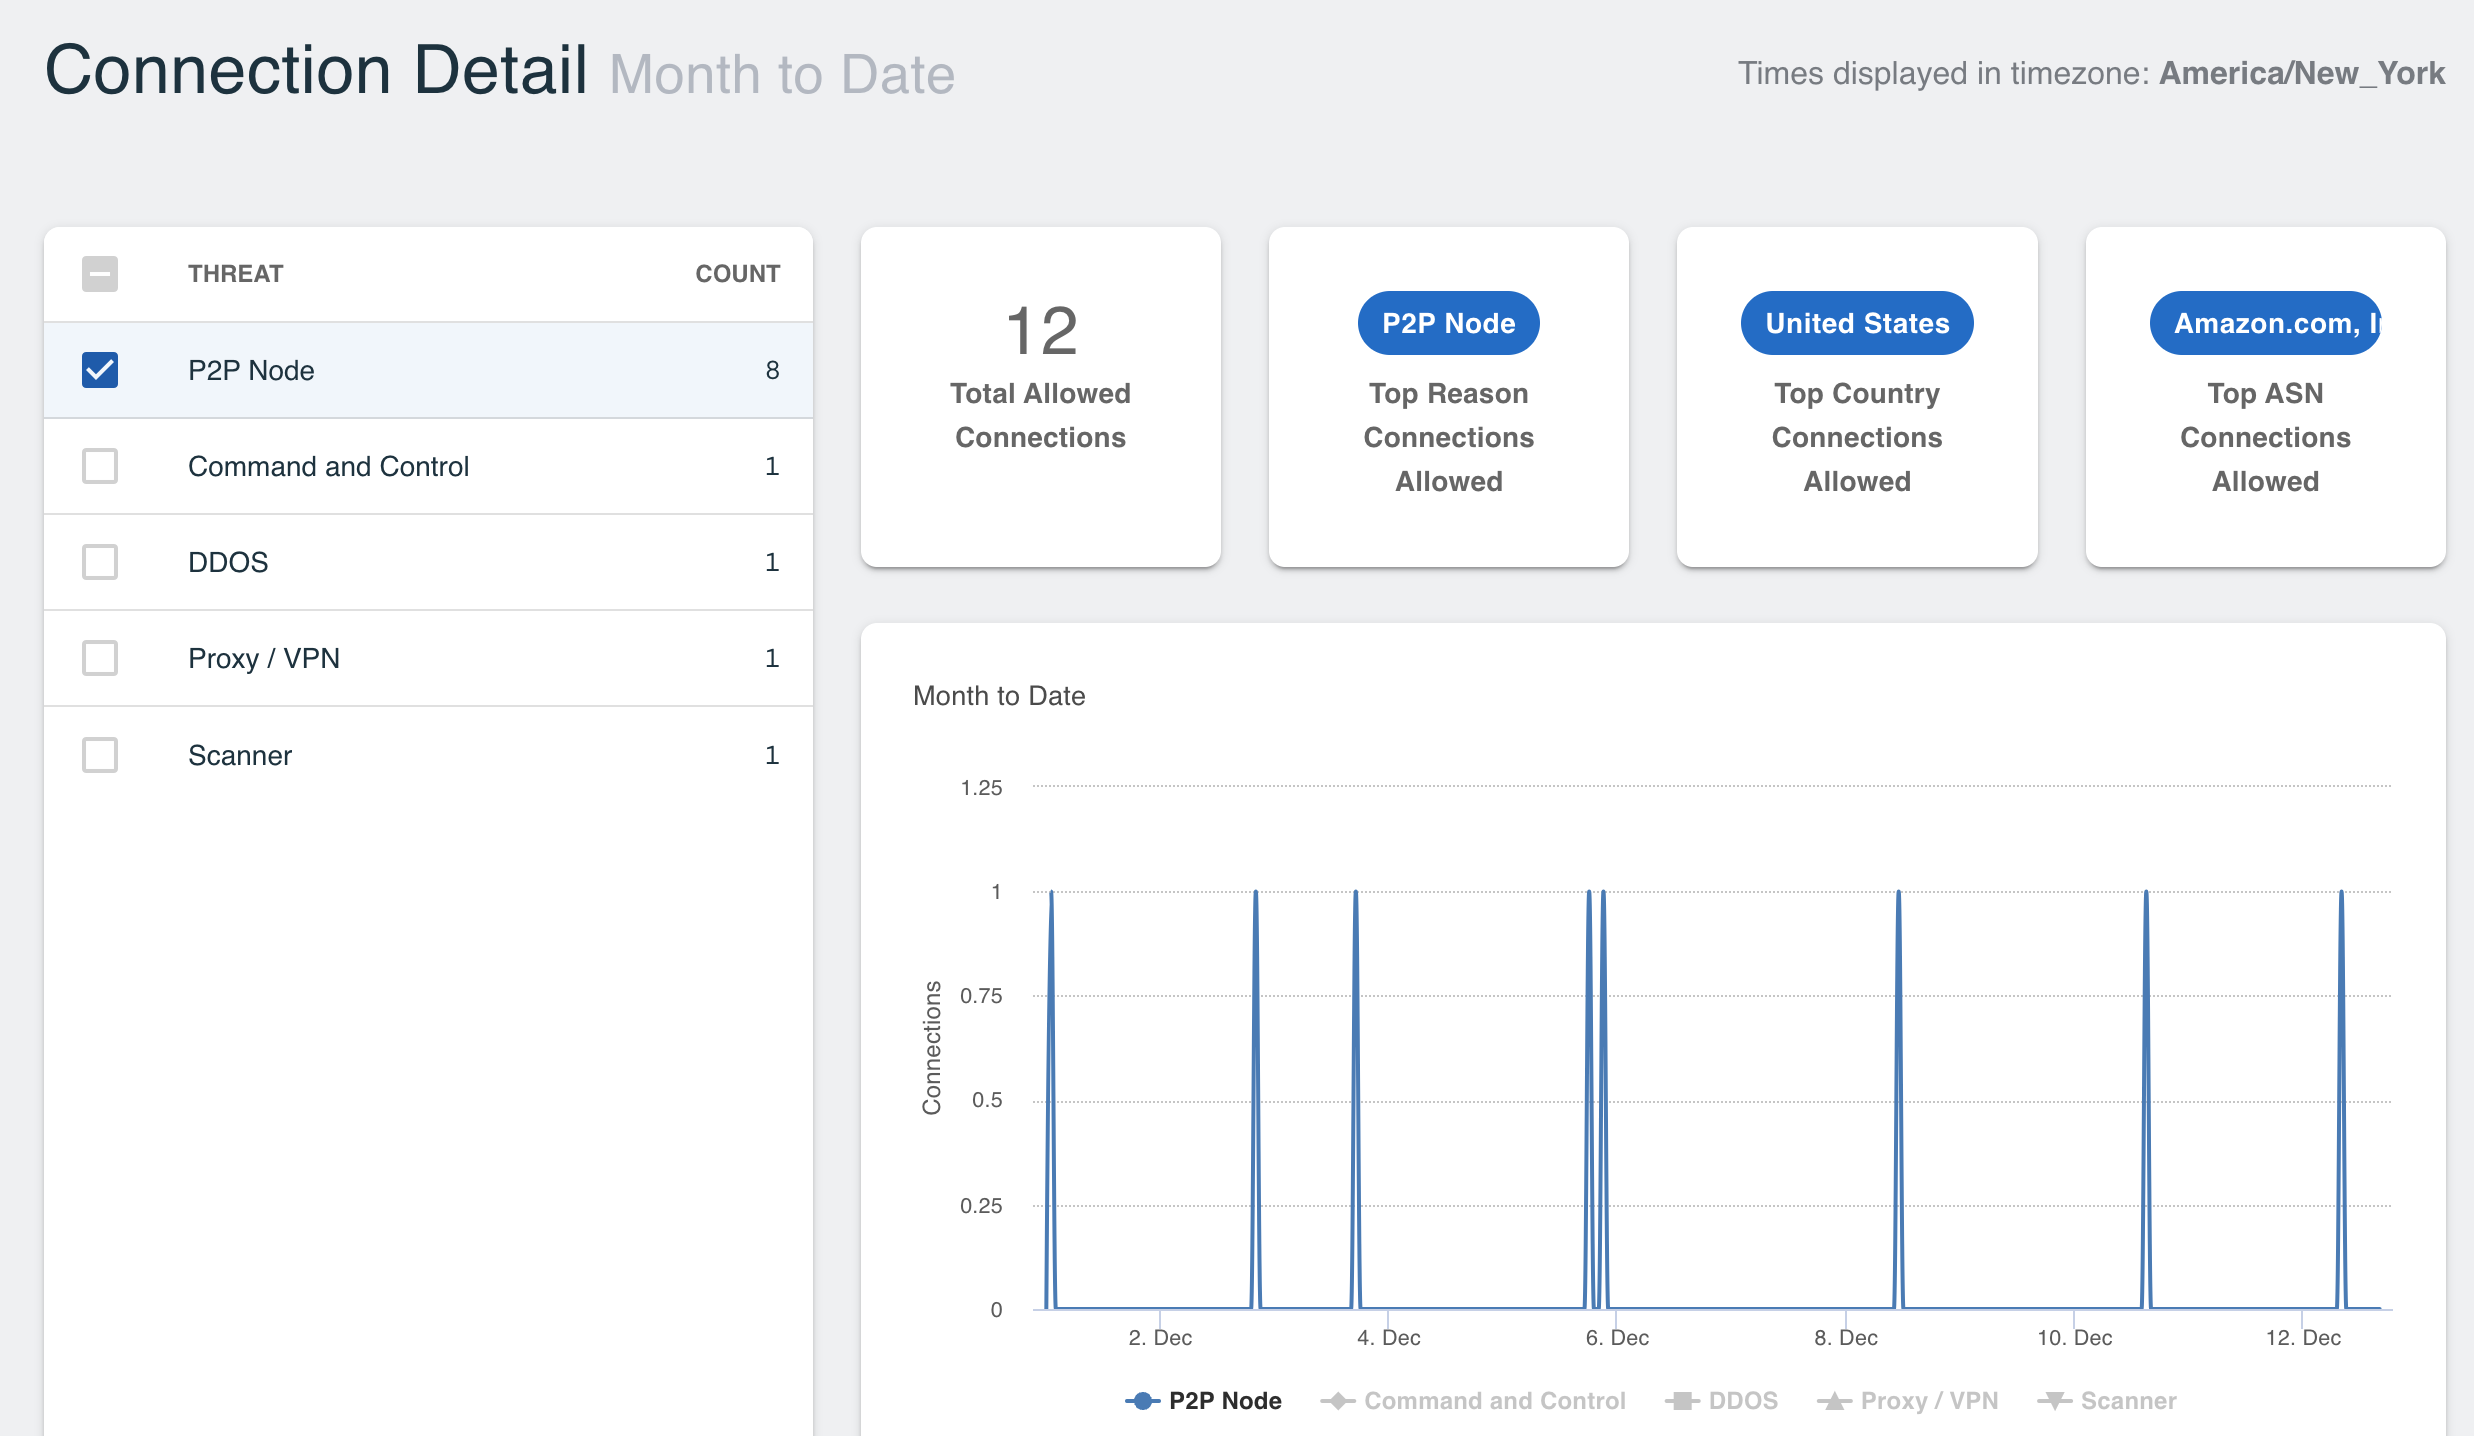
The 1st tab is the Reason Summary, which showcases the number of unique connections allowed or blocked by reason over a specified period. This includes country, ASN, lists (allow or block) and IP reputation (threat lists). Added together is the total connections in the time period specified in the drop-down.
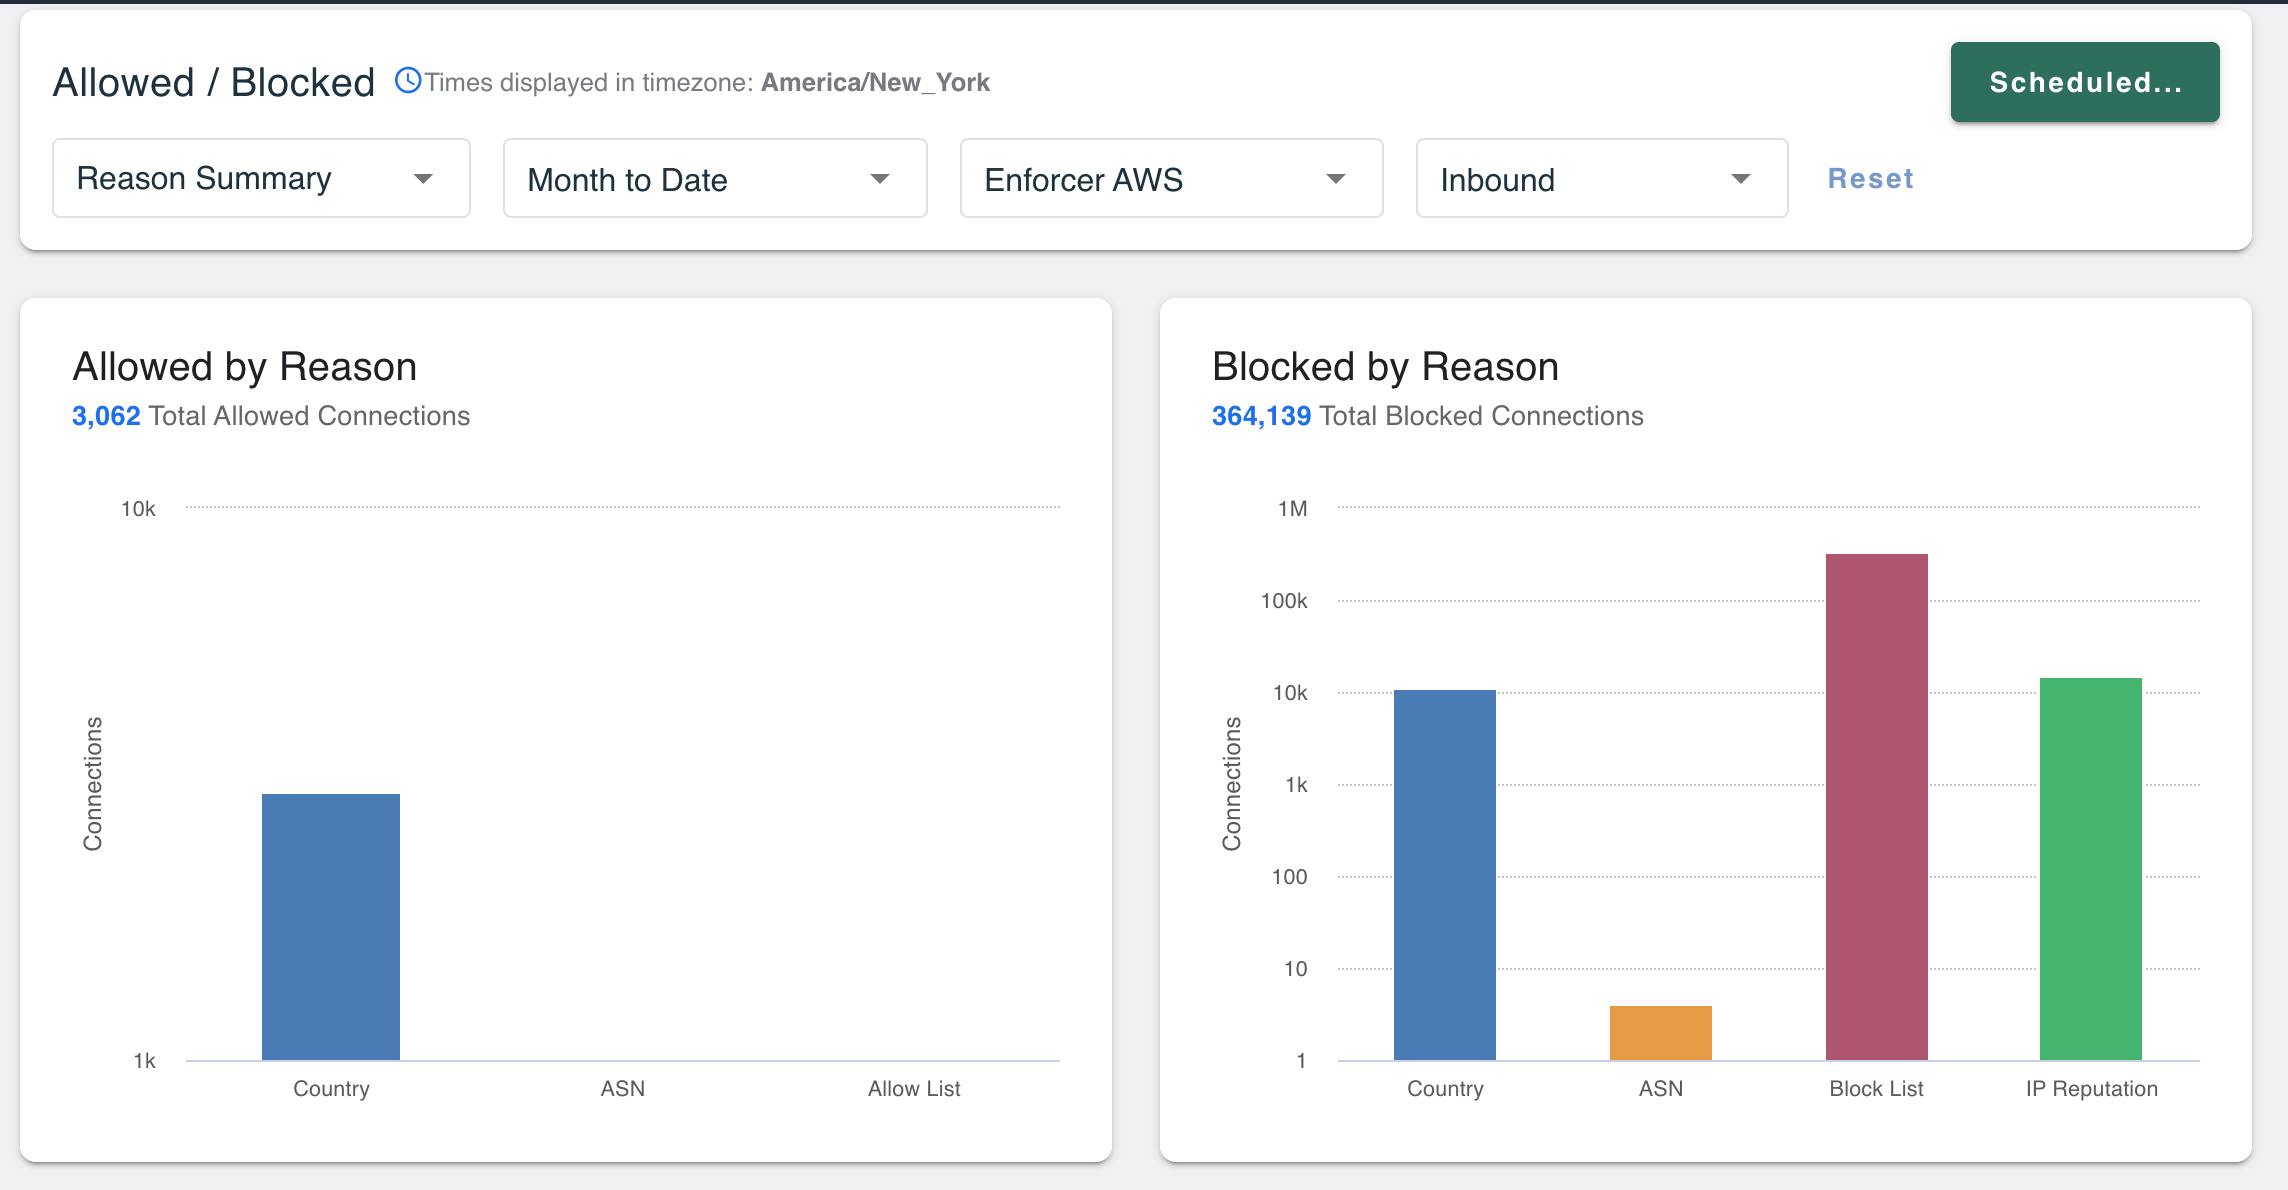
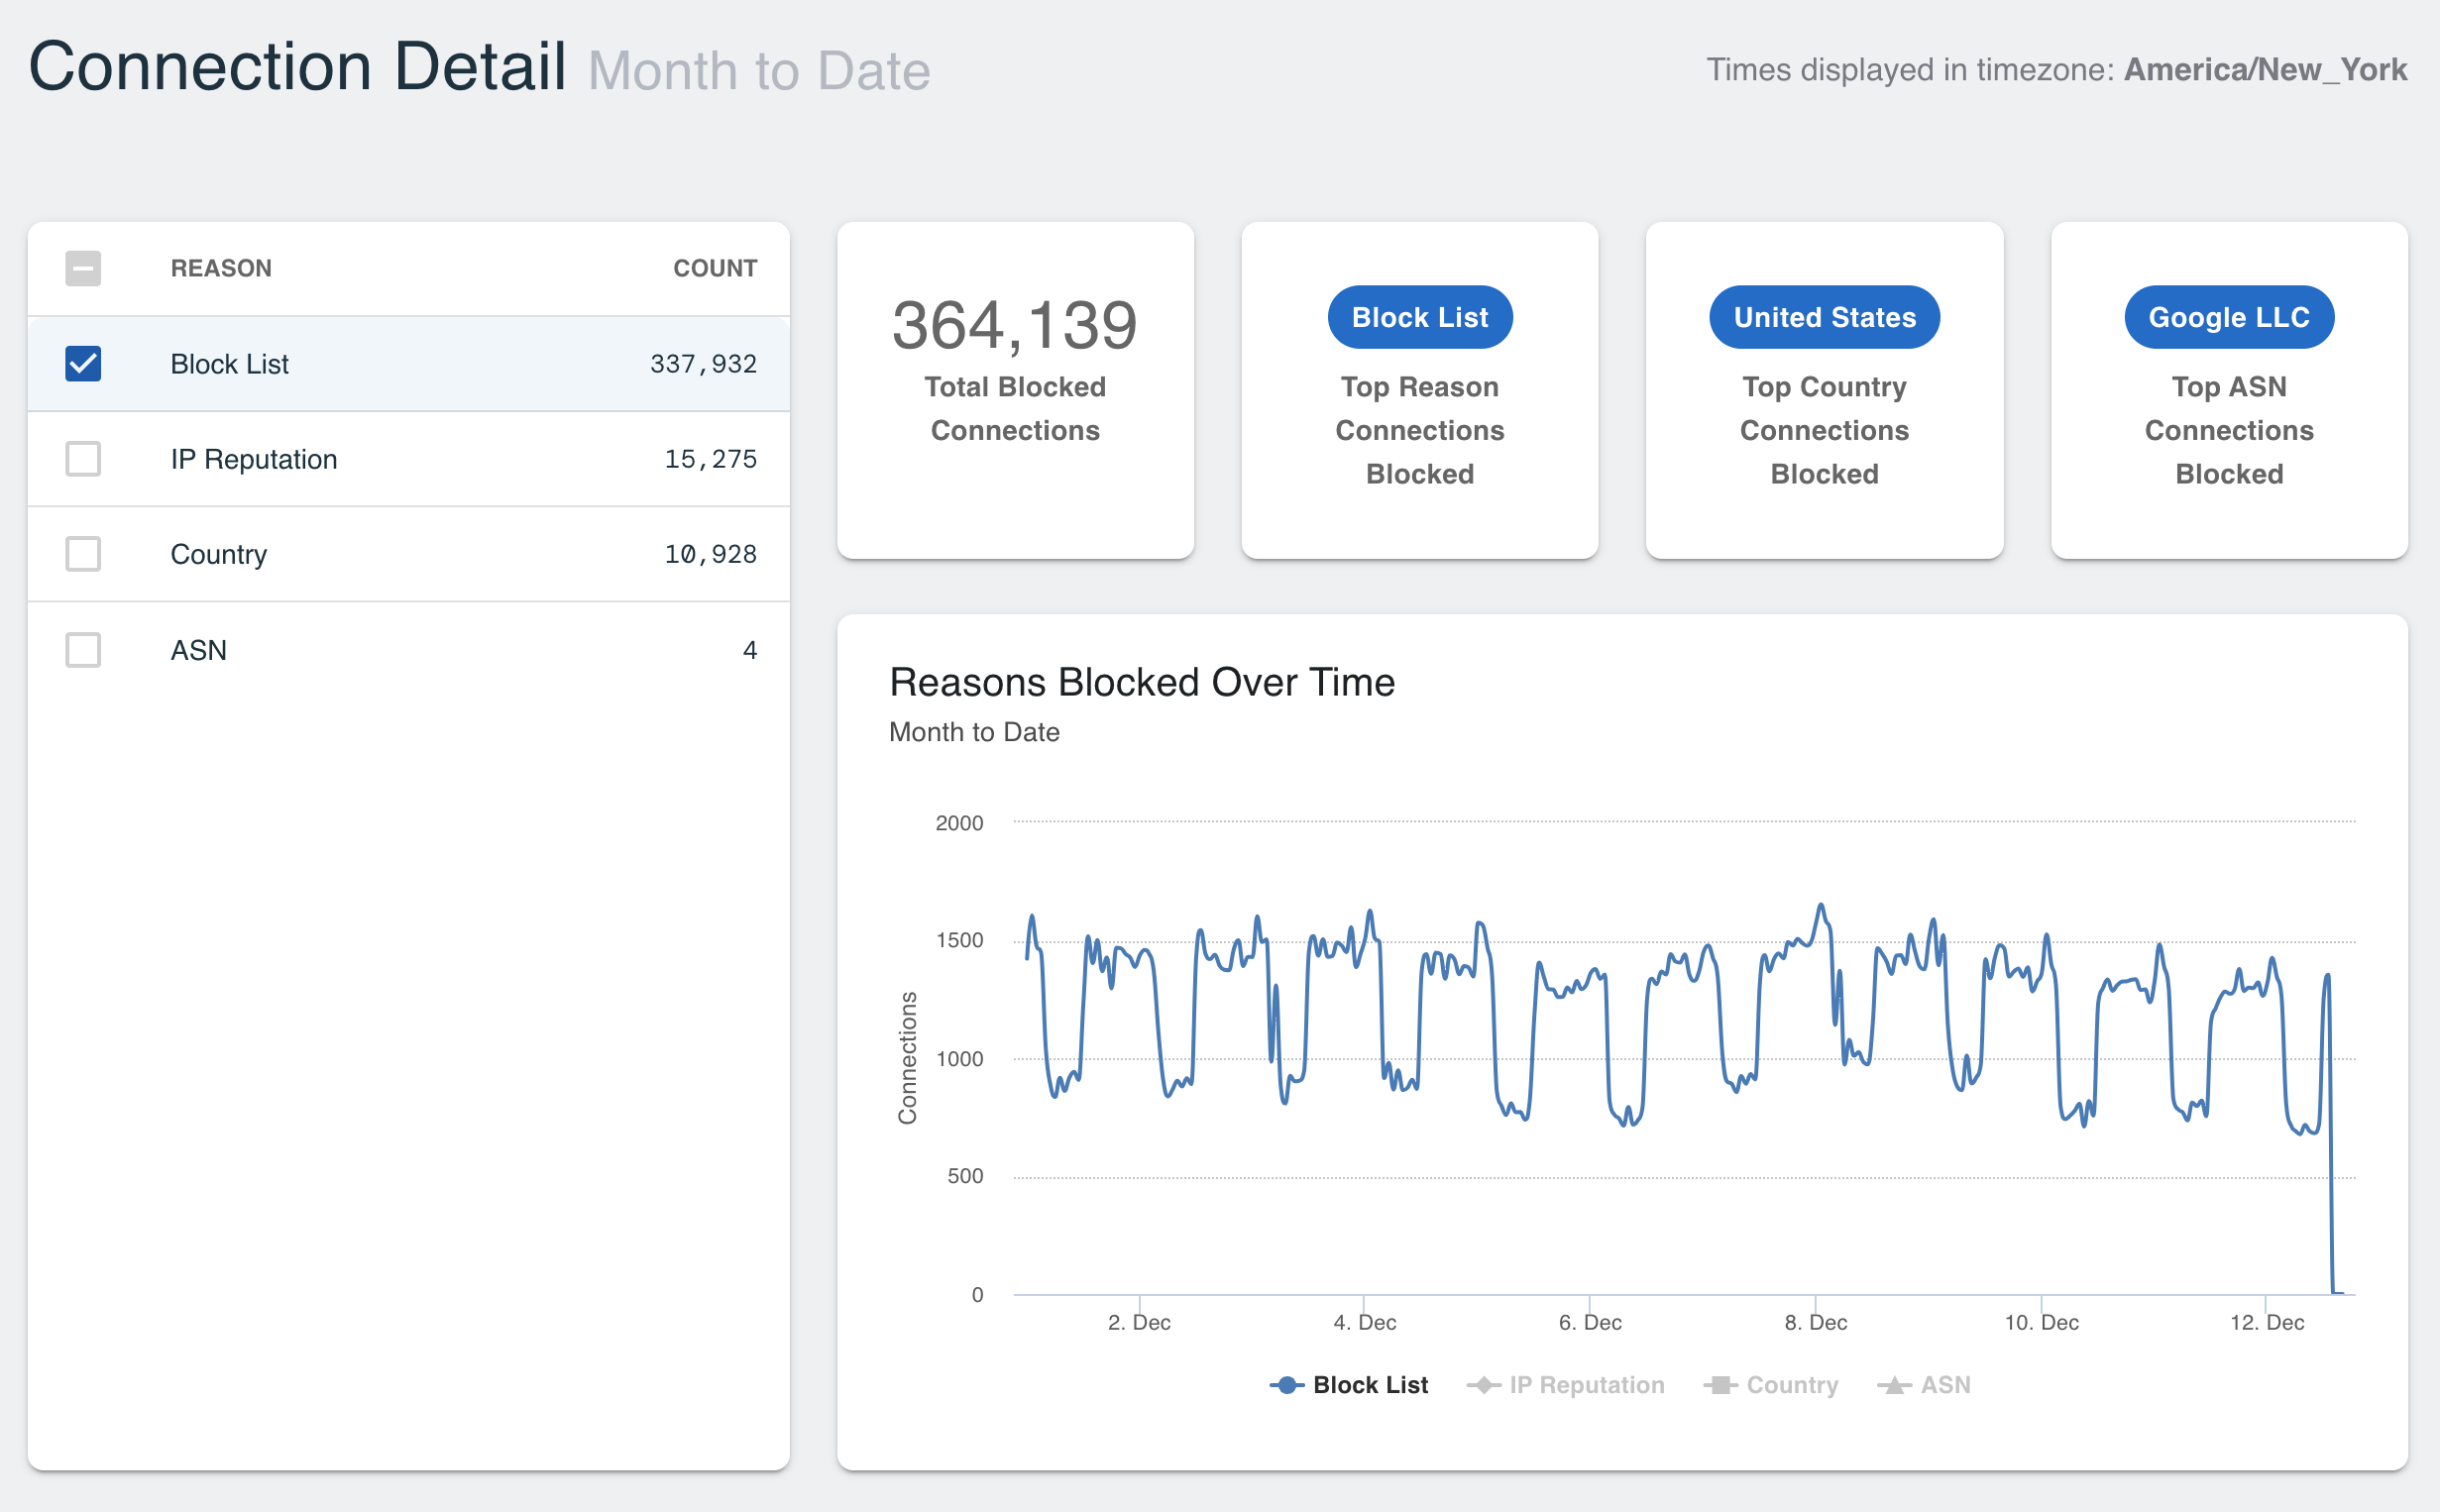
Click into the bar line item to see the connection detail by reason. Get a unique count of each reason, an overview of the top performing connections by policy and track the reason count over time.
Category Summary
The Category Summary tab is related to the threat list, where each IP has an associate category and risk score. This information has been categorized by the threat list as a potential threat but is allowed or blocked based on the risk scores enabled at the policy level. These graphs are not based on an unique count, as IPs can appear in multiple categories.
For example, the Endpoint Exploits category in the below graph is the highest line item for the Blocked by Category chart. This indicates that the connection was blocked and in this specific threat category. End users will be able to view the types of threats that are coming in or being seen outside of the Network by searching for individual IPs in the IOC tab or through logs in the Enforcer.
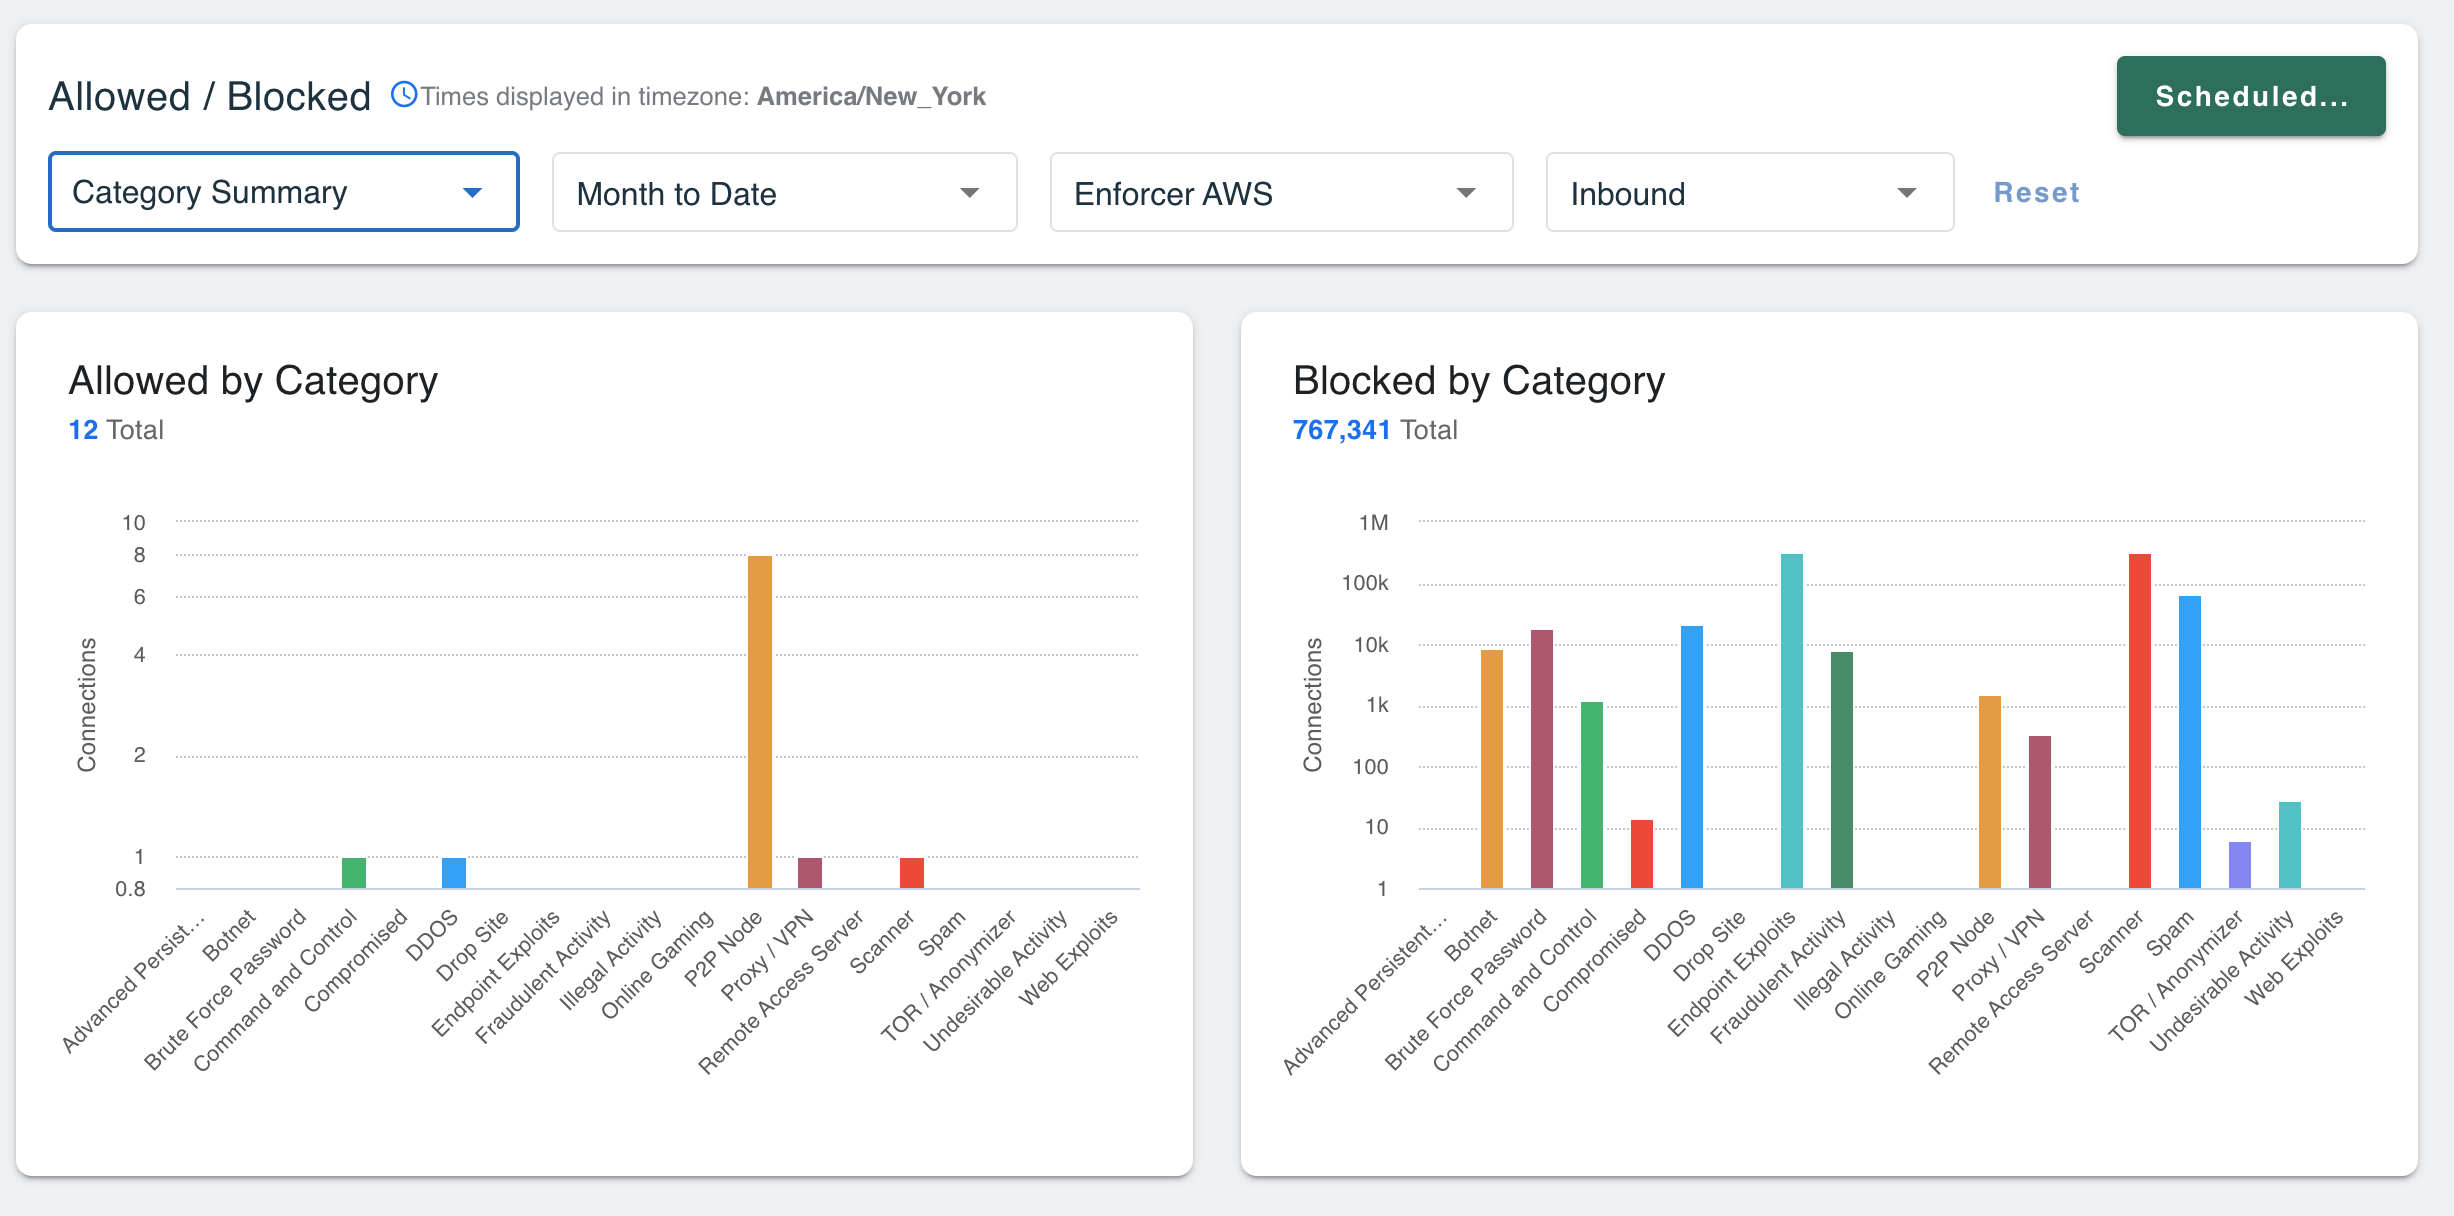
The Allowed by Category will display connections that were allowed, even for connections where the IP appeared on a Threat List. There are two reasons why a threat IP would be on the Allowed List:
-
The IP is on the Allow List (IPs on Allow Lists supersede the Threat List)
-
The Risk Score is lower than the category threshold
We recommend looking at the stats for this graph, especially for Inbound policy, and consider lowering the risk thresholds for categories that are seeing a higher volume allowed. For categories that are more specific, like "Endpoint Exploits" or "Command and Control," admins can make adjustments to those categories under the inbound policy by adjusting the default setting from 90 and lowering the score to block more potential threats.
End users can also click into the bar graphs to see the connection detail by reason. A unique count of each reason can be selected to display an overview of the top performing connections by policy and track the reason count over time.
Top 10 Countries
The Top 10 Countries report displays the top 10 countries that were allowed or blocked by total unique connections.
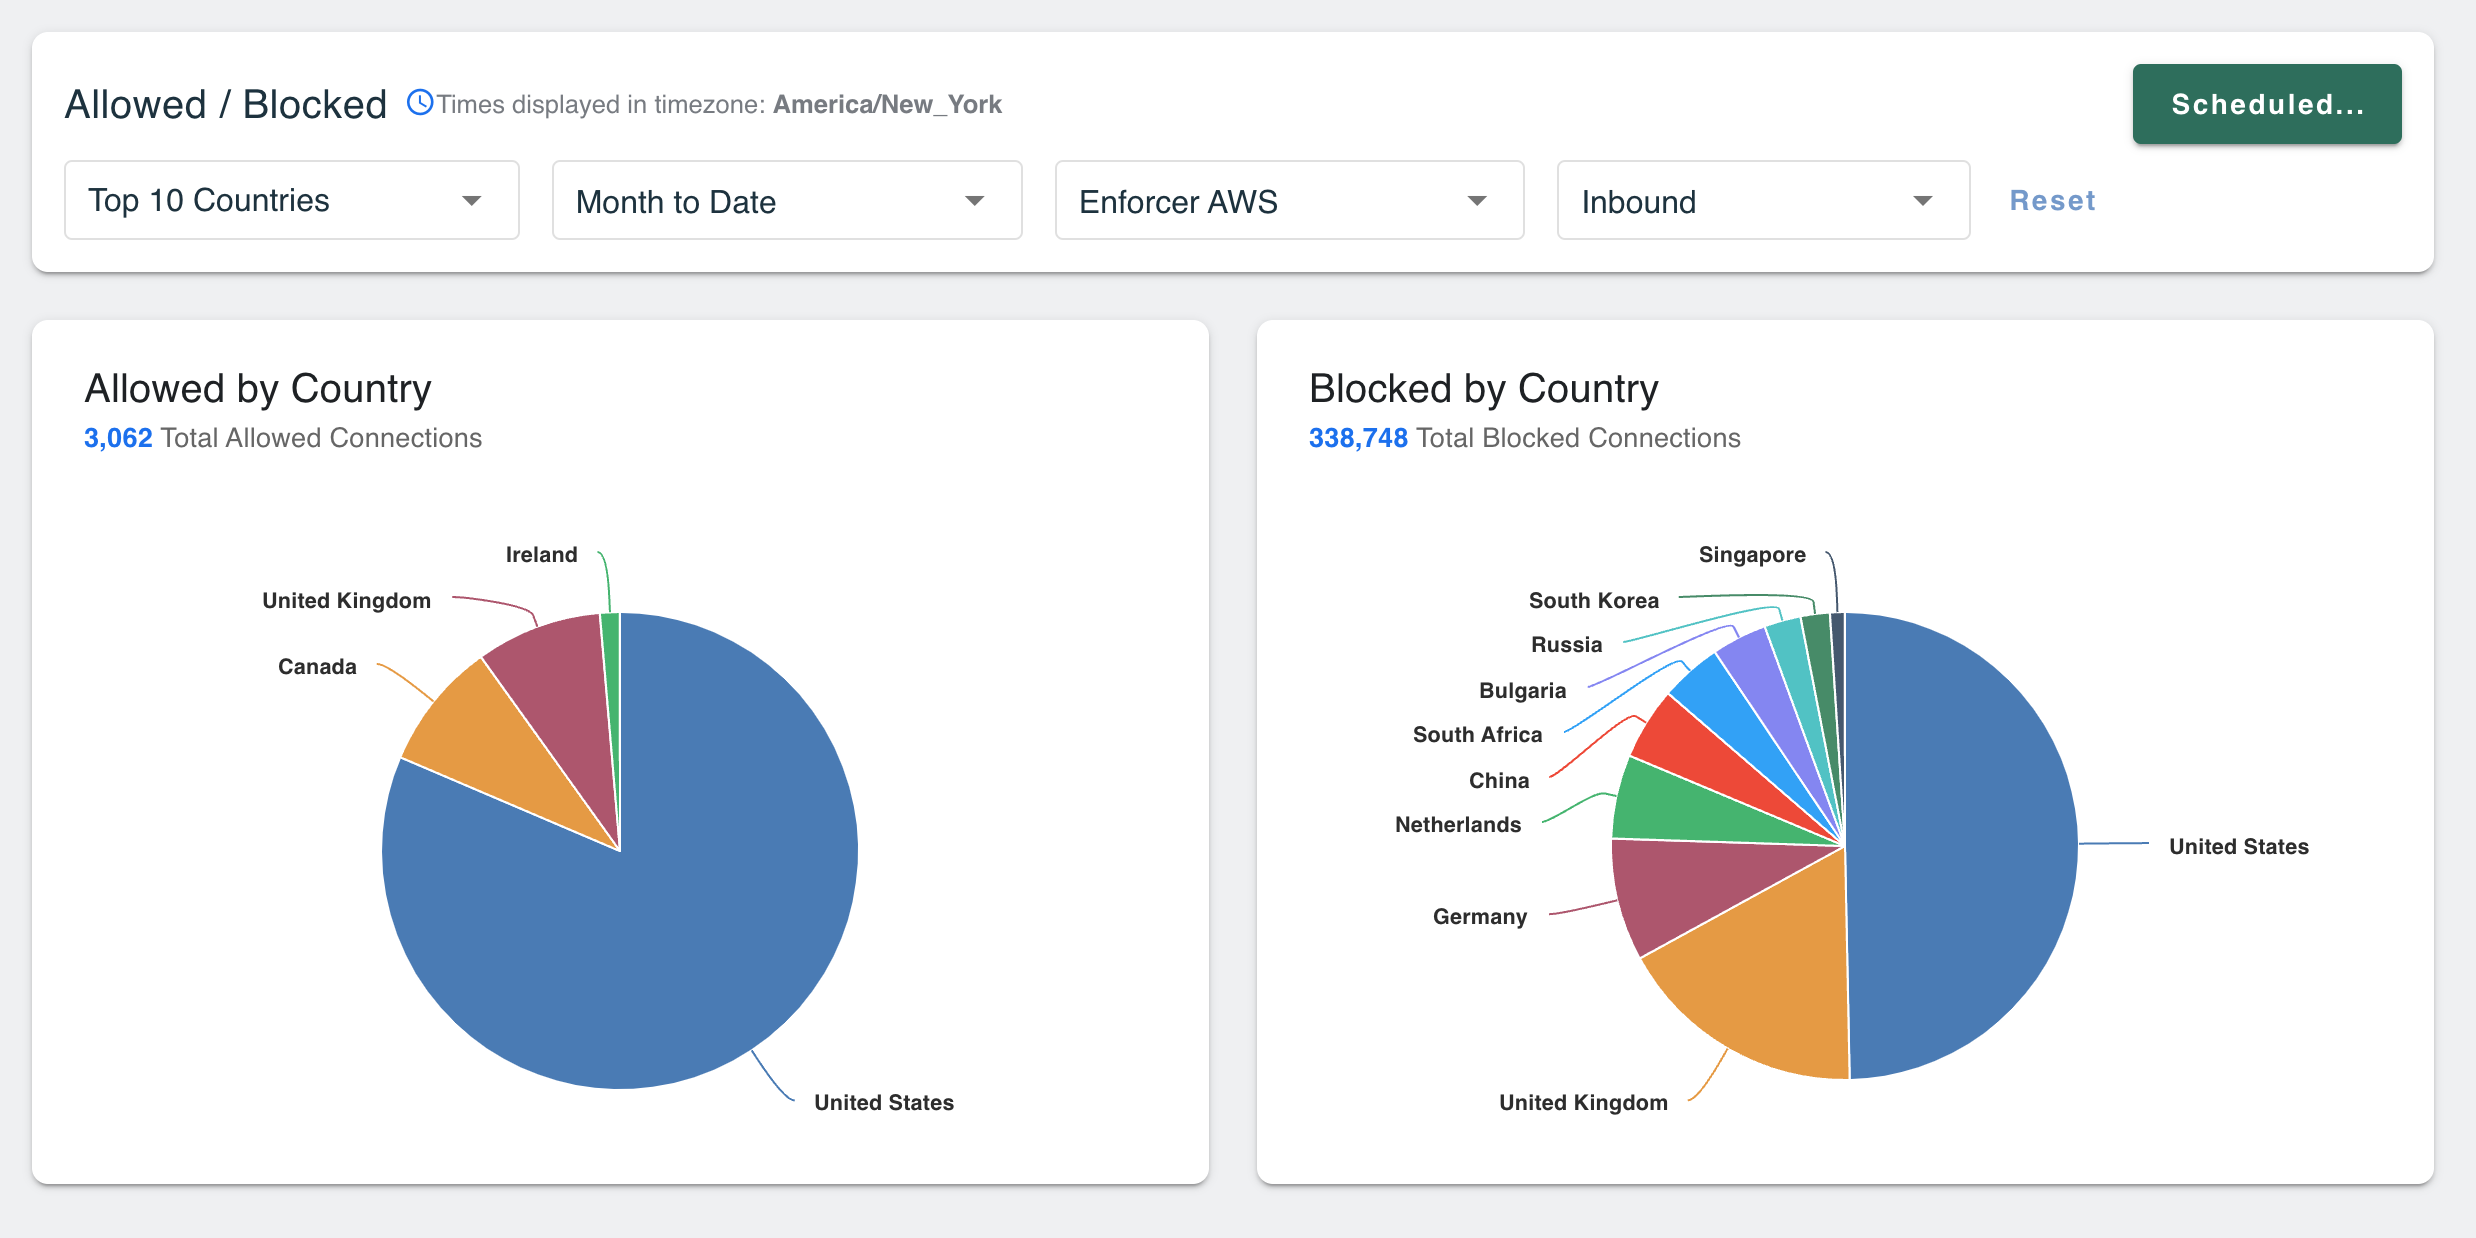
These modals should be considered for blocking additional countries, especially if organizations aren't expecting traffic inbound from those locations.
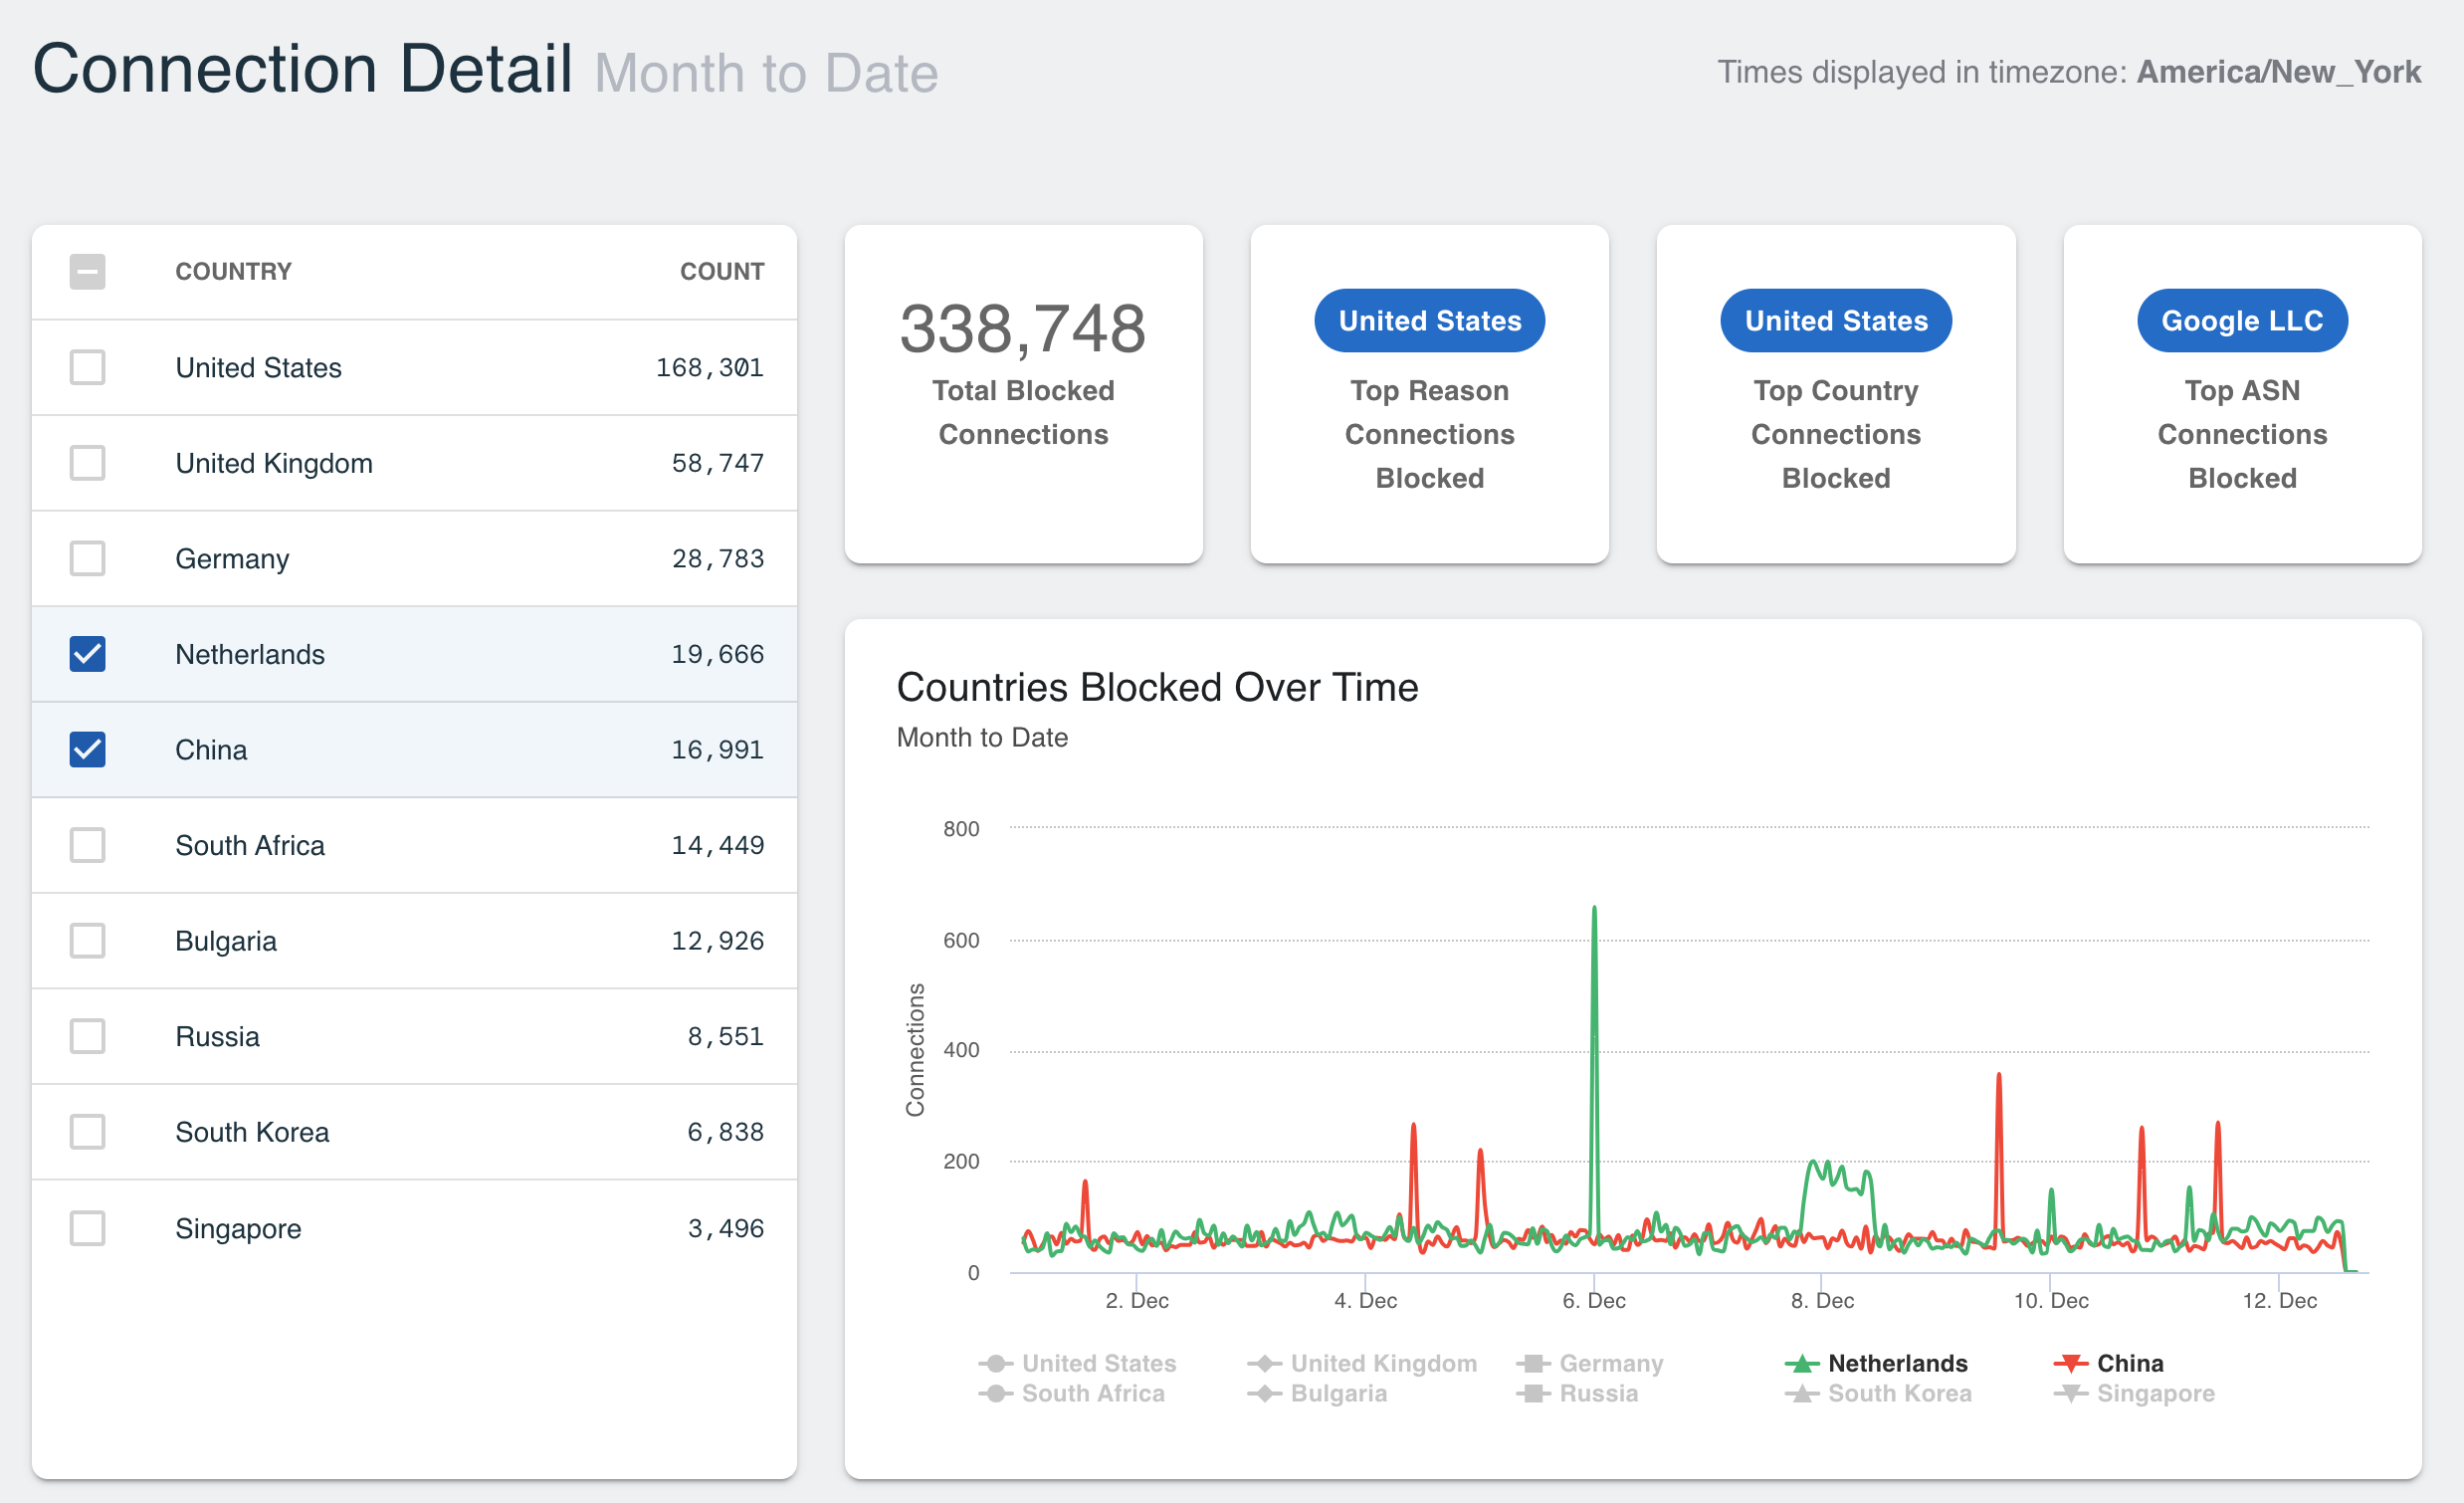
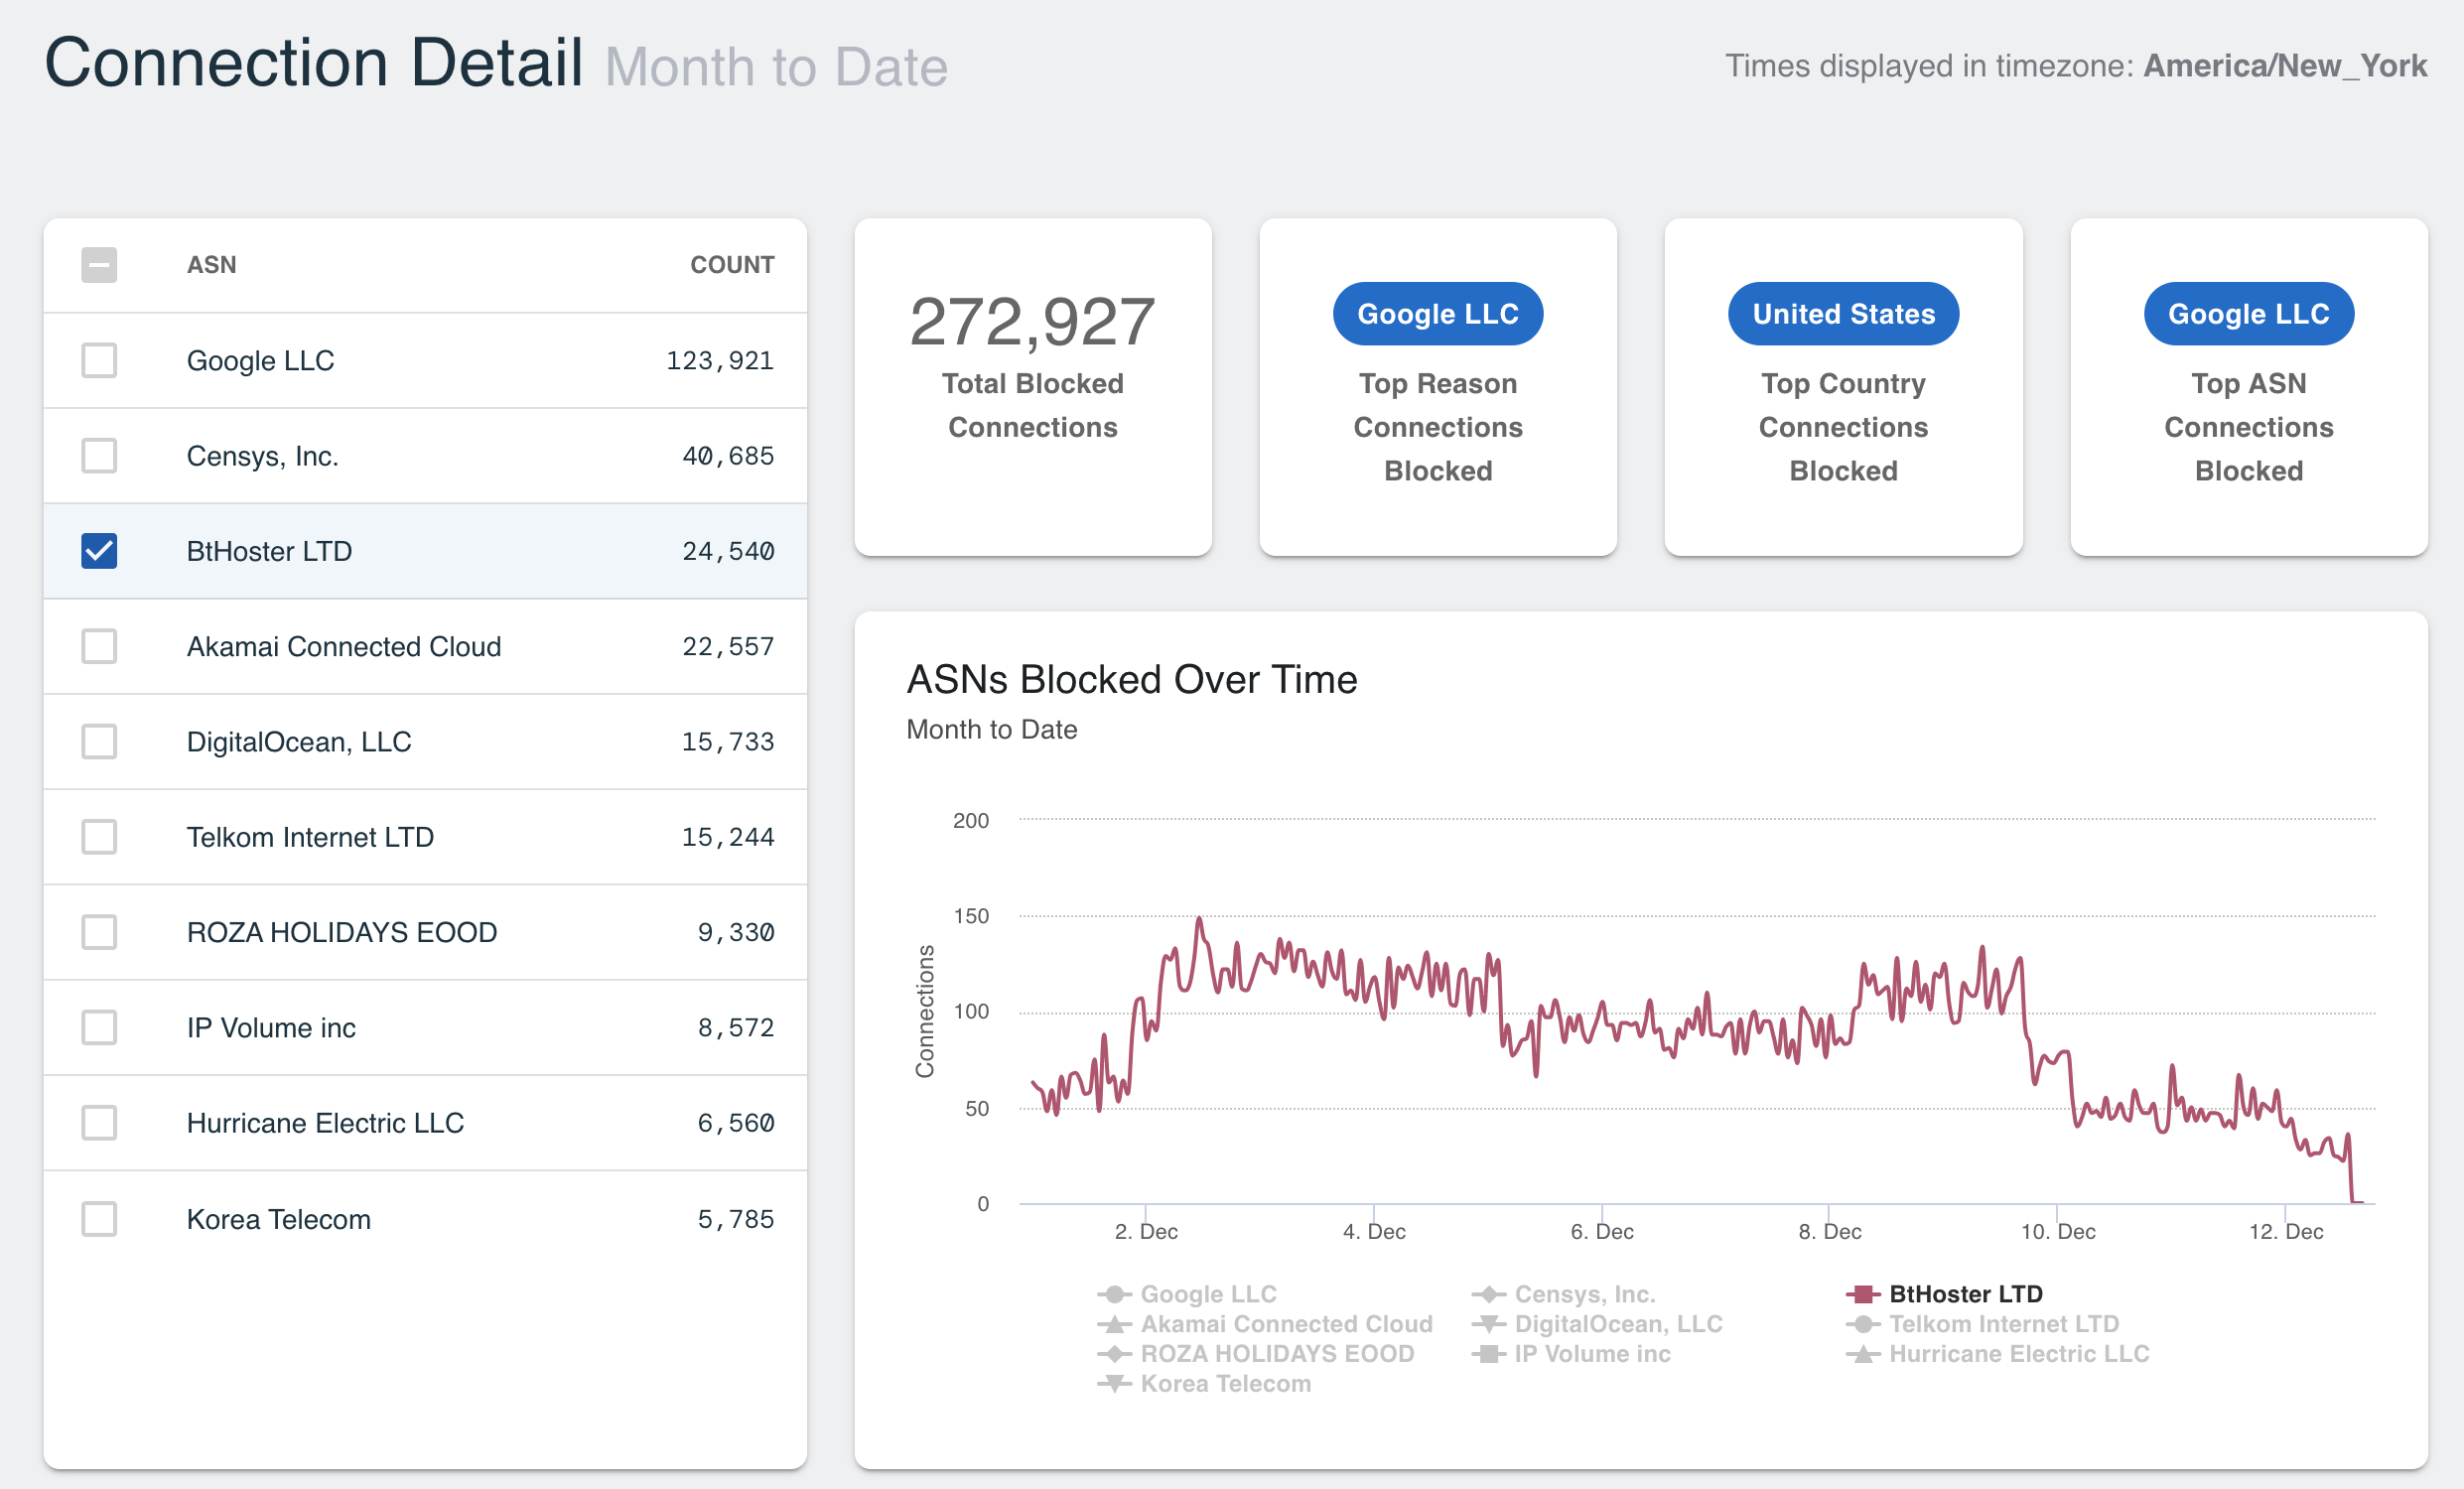
Clicking on the slide of data will open the Connect Detail for the dashboard and display the Country and Count panel. Selecting additional countries will add that data to the graph on the right.
Top 10 ASNs
The Top 10 ASNs dashboard displays the top 10 ASNs that were allowed or blocked by total unique connections.
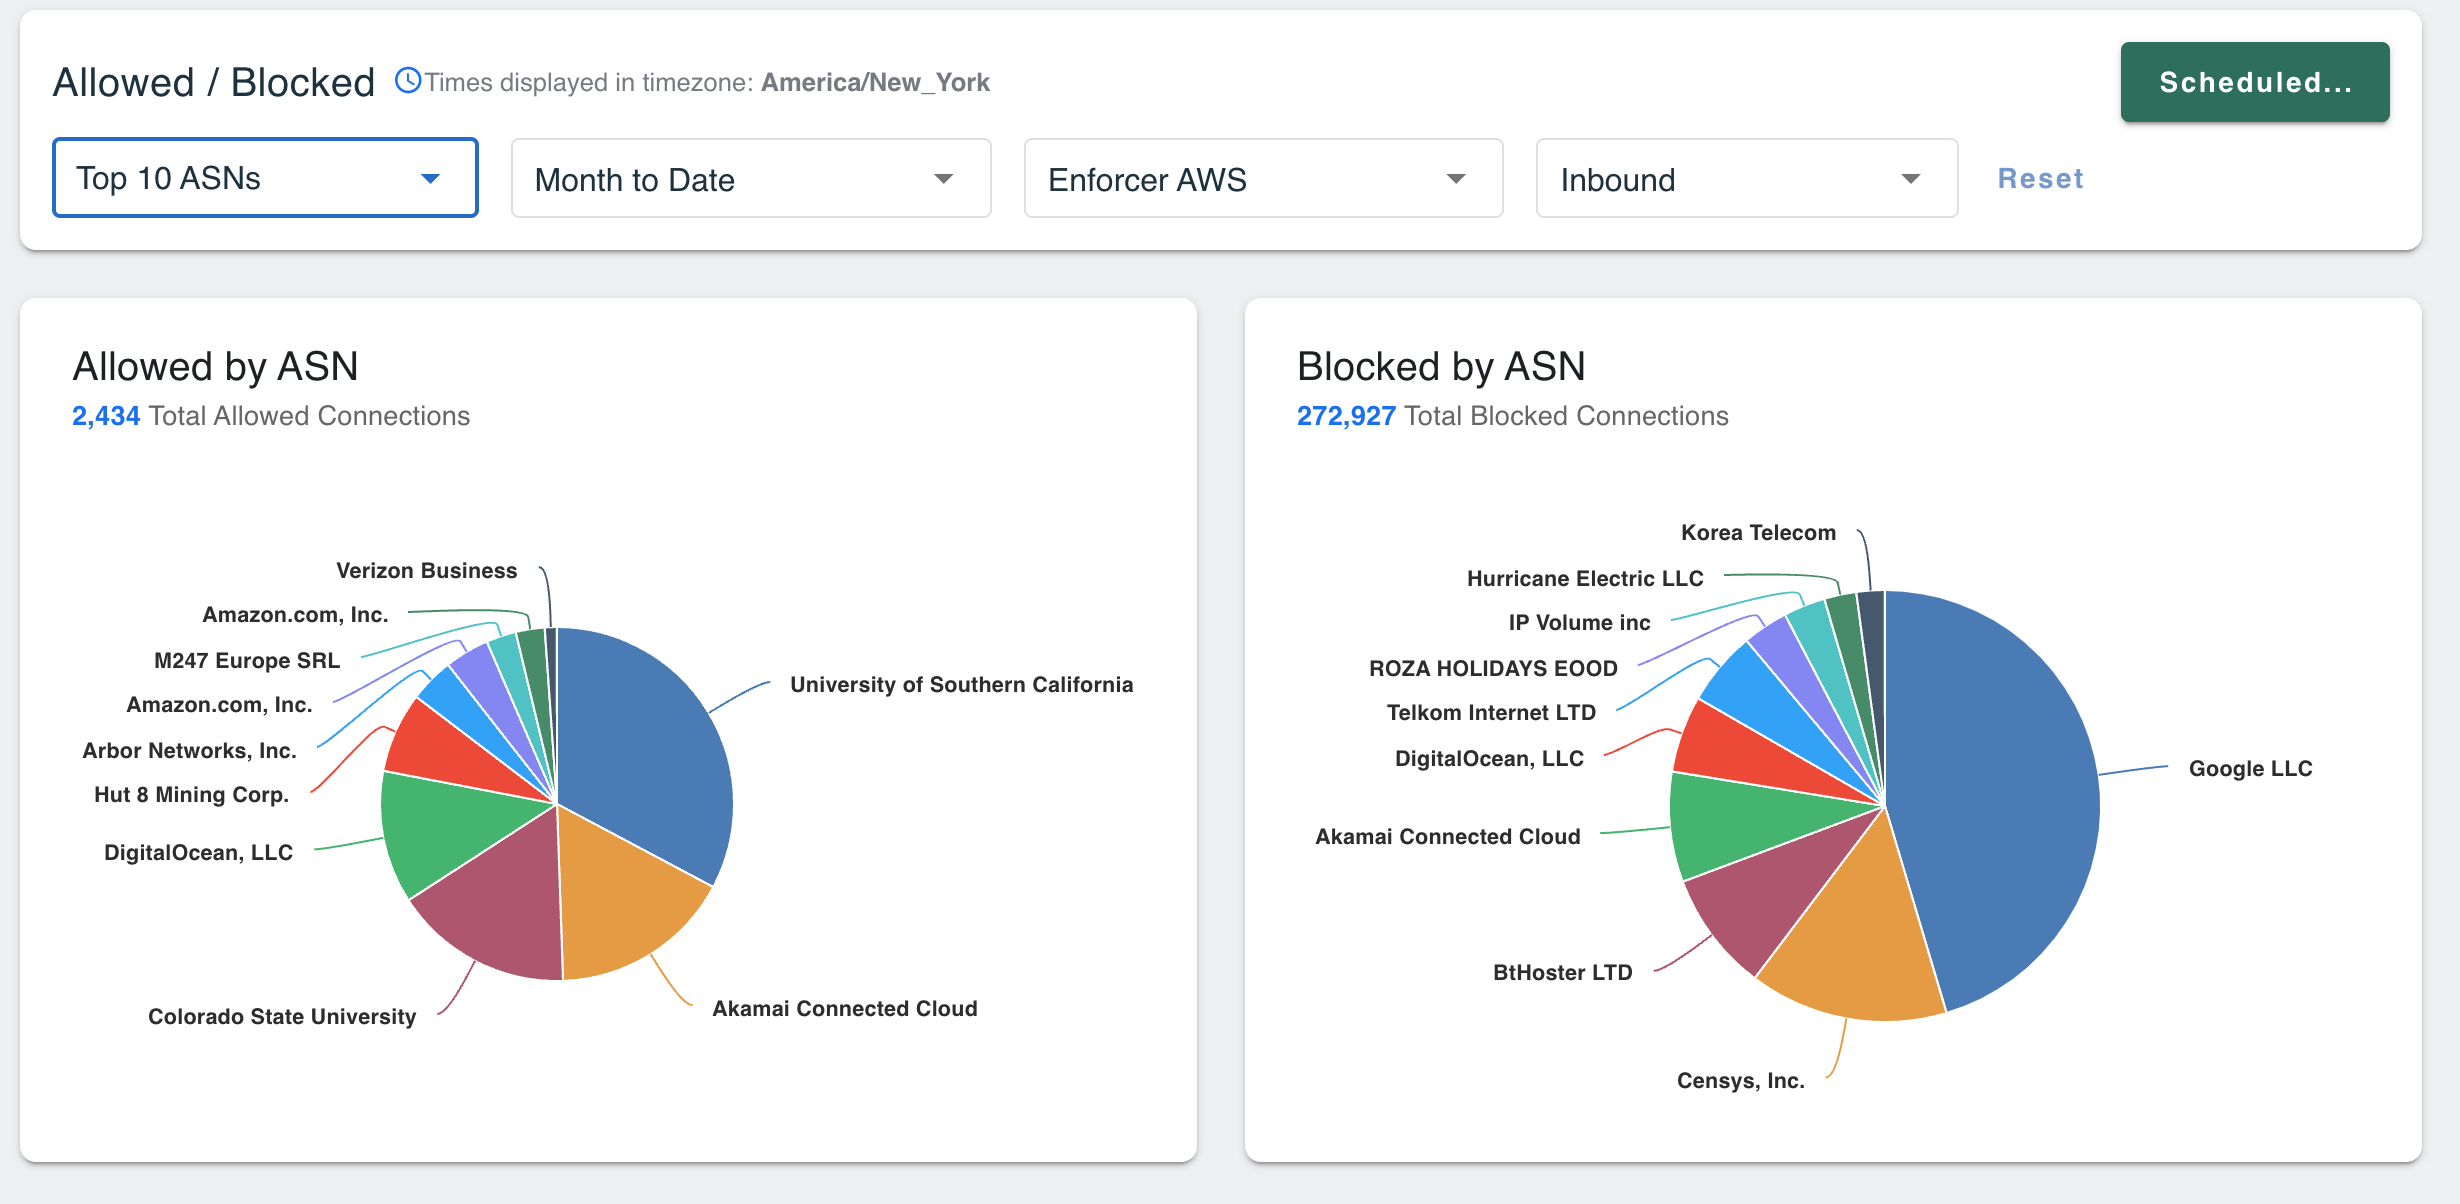
These modals should be considered for blocking additional ASNs on a per policy basis, especially if organizations aren't expecting traffic inbound from those ASNs.
Clicking on the slide of data will open the Connect Detail for the dashboard and display the ASN and Count panel. Selecting additional countries will add that data to the graph on the right.
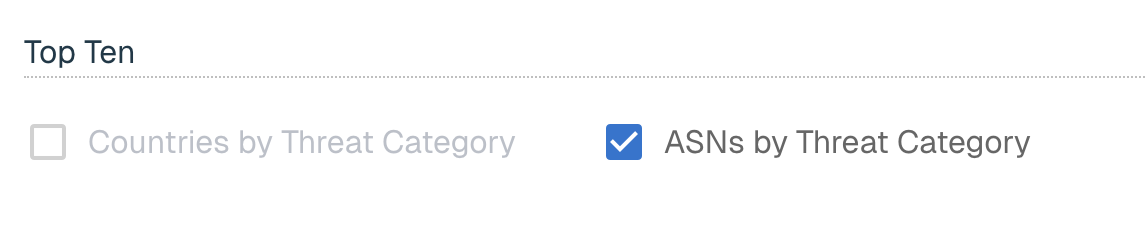
Top 10
There are two options that display information on top 10 list on Threat categories. This data can be filtered based on various preset or custom timeframes or on a per-Enforcer basis.
Countries by Threat Category
The Top 10 Countries by Threat Category report displays the top 10 countries blocked due to specified threat category(s). Admins can narrow their search by date range and Enforcers, and select multiple threat categories at once for comparison.
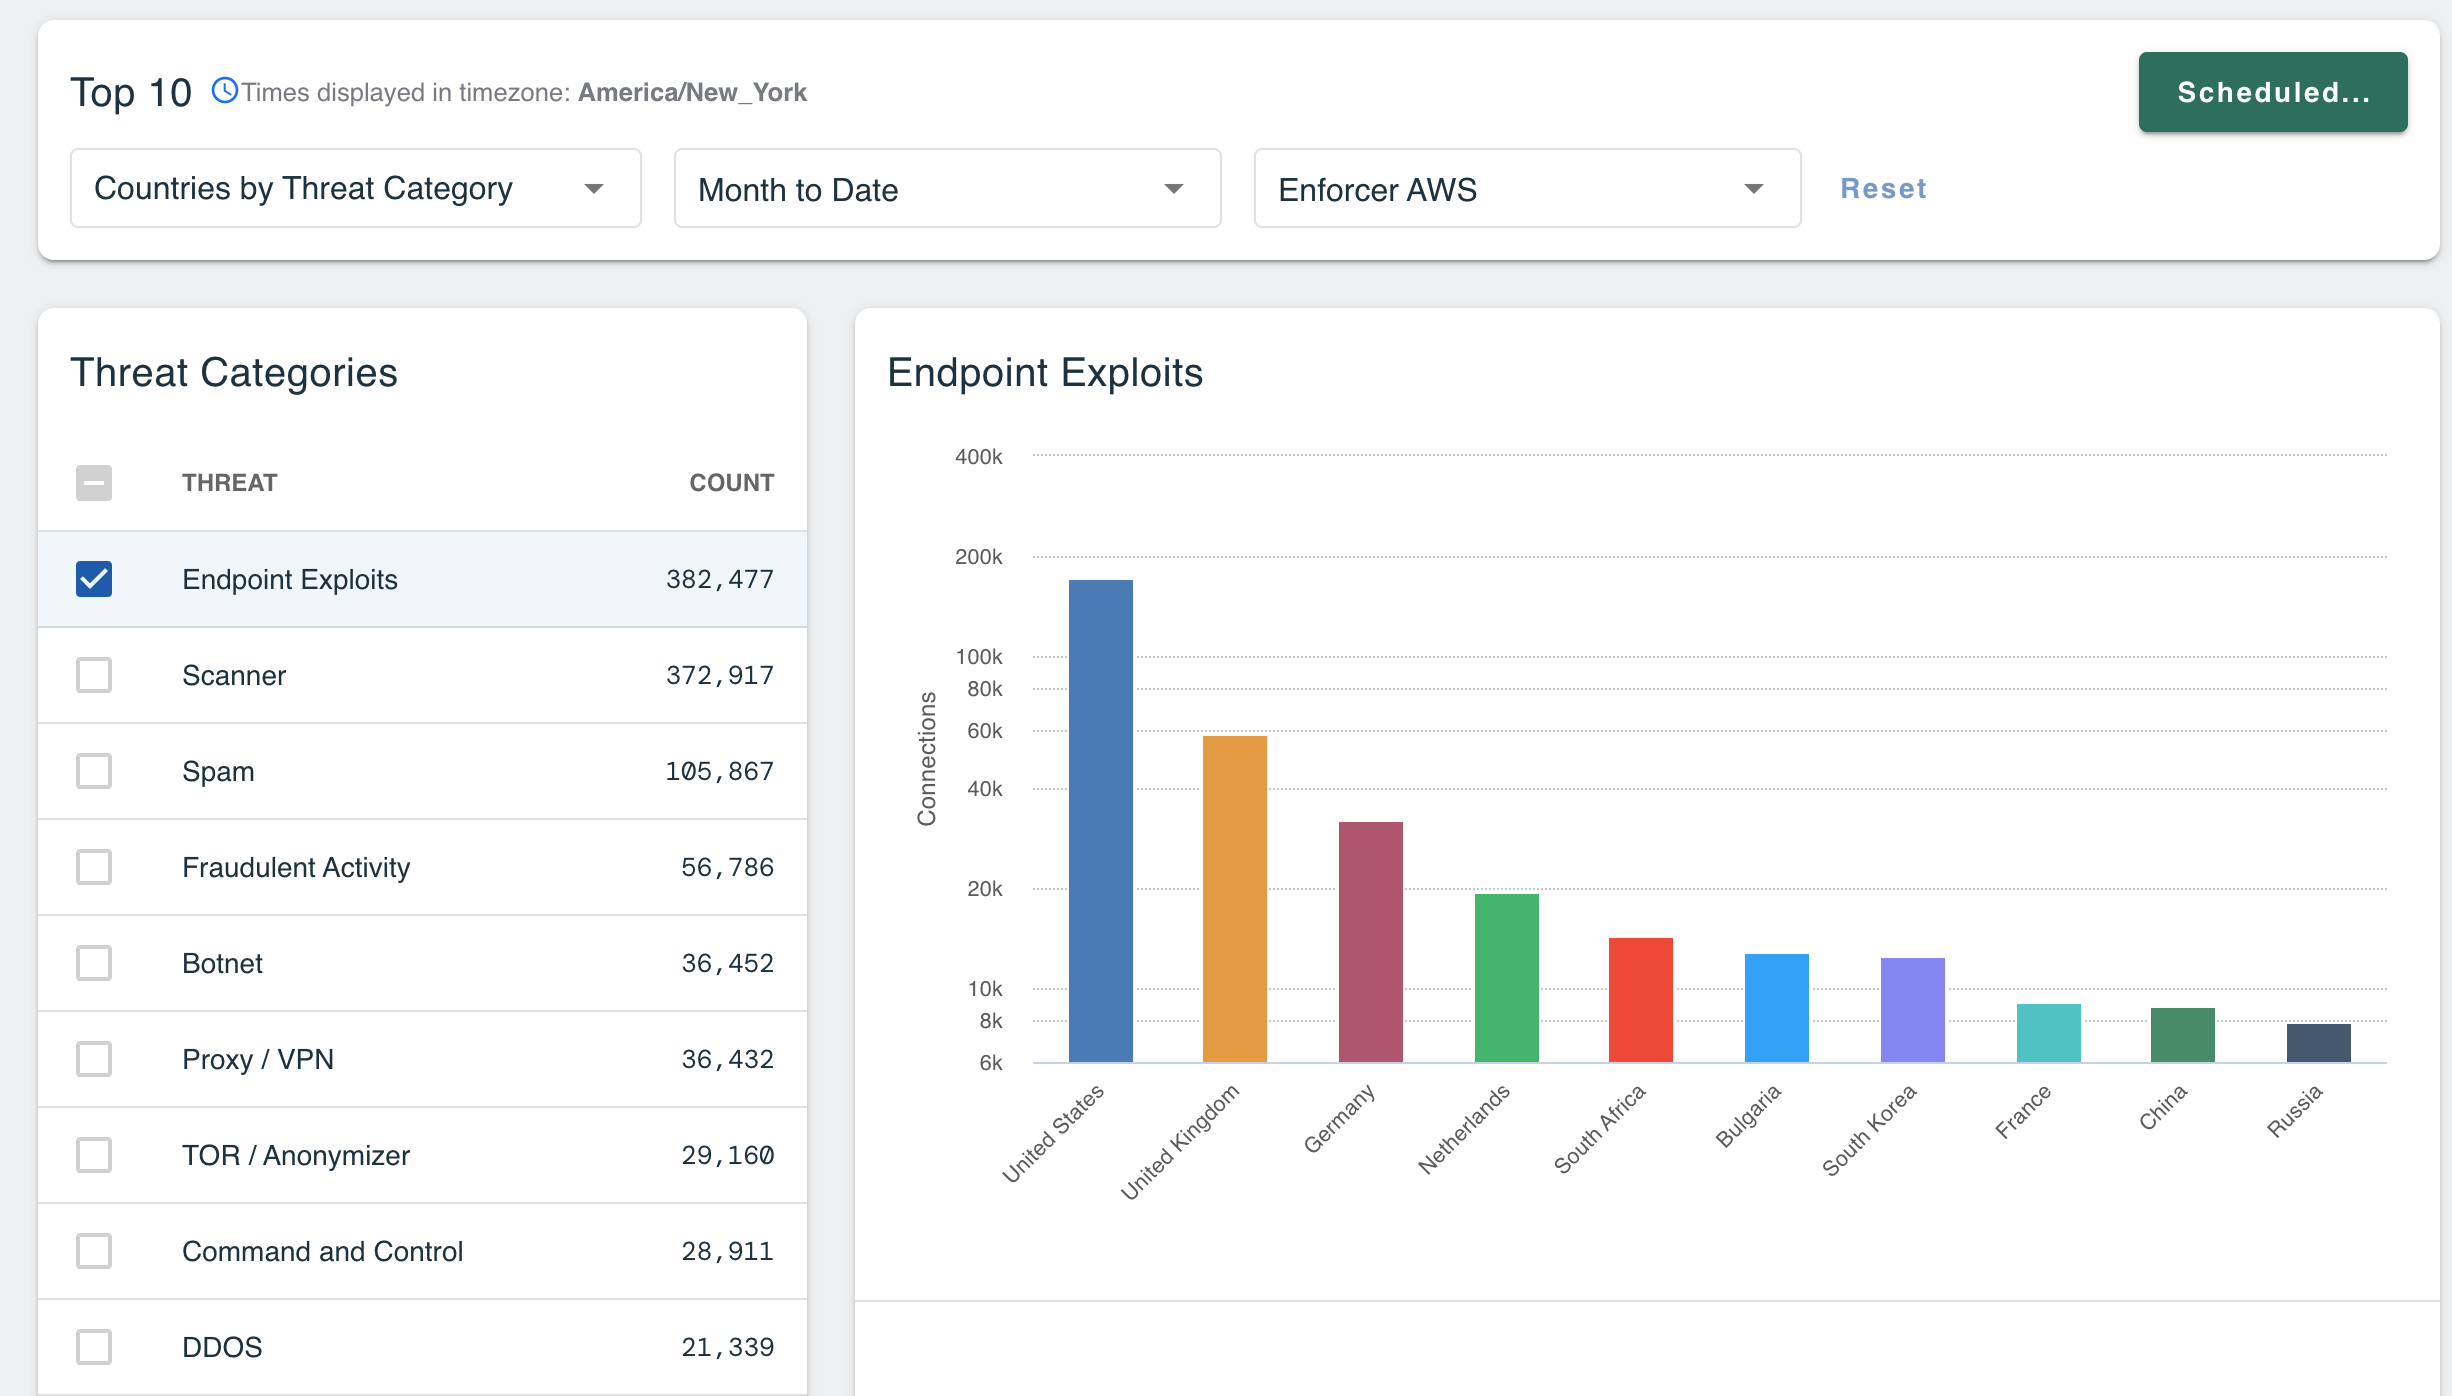
The Threat Category with the highest count will be selected by default and its graph will display in the right-hand panel. To view a graph for additional Threat Categories, select the desired category(s) in the left-hand panel.
Each threat category graph will display a bar for the top 10 countries with connections that have been flagged with that threat category. You can scroll over each bar to view the number of connections, based on the timeframe and Enforcer selected from the filters at the top of the screen.
ASNs by Threat Category
The Top 10 ASNs by Threat Category report displays the top 10 ASNs blocked due to specified threat category(s). Admins can narrow their search by date range and Enforcers, and select multiple threat categories at once for comparison.
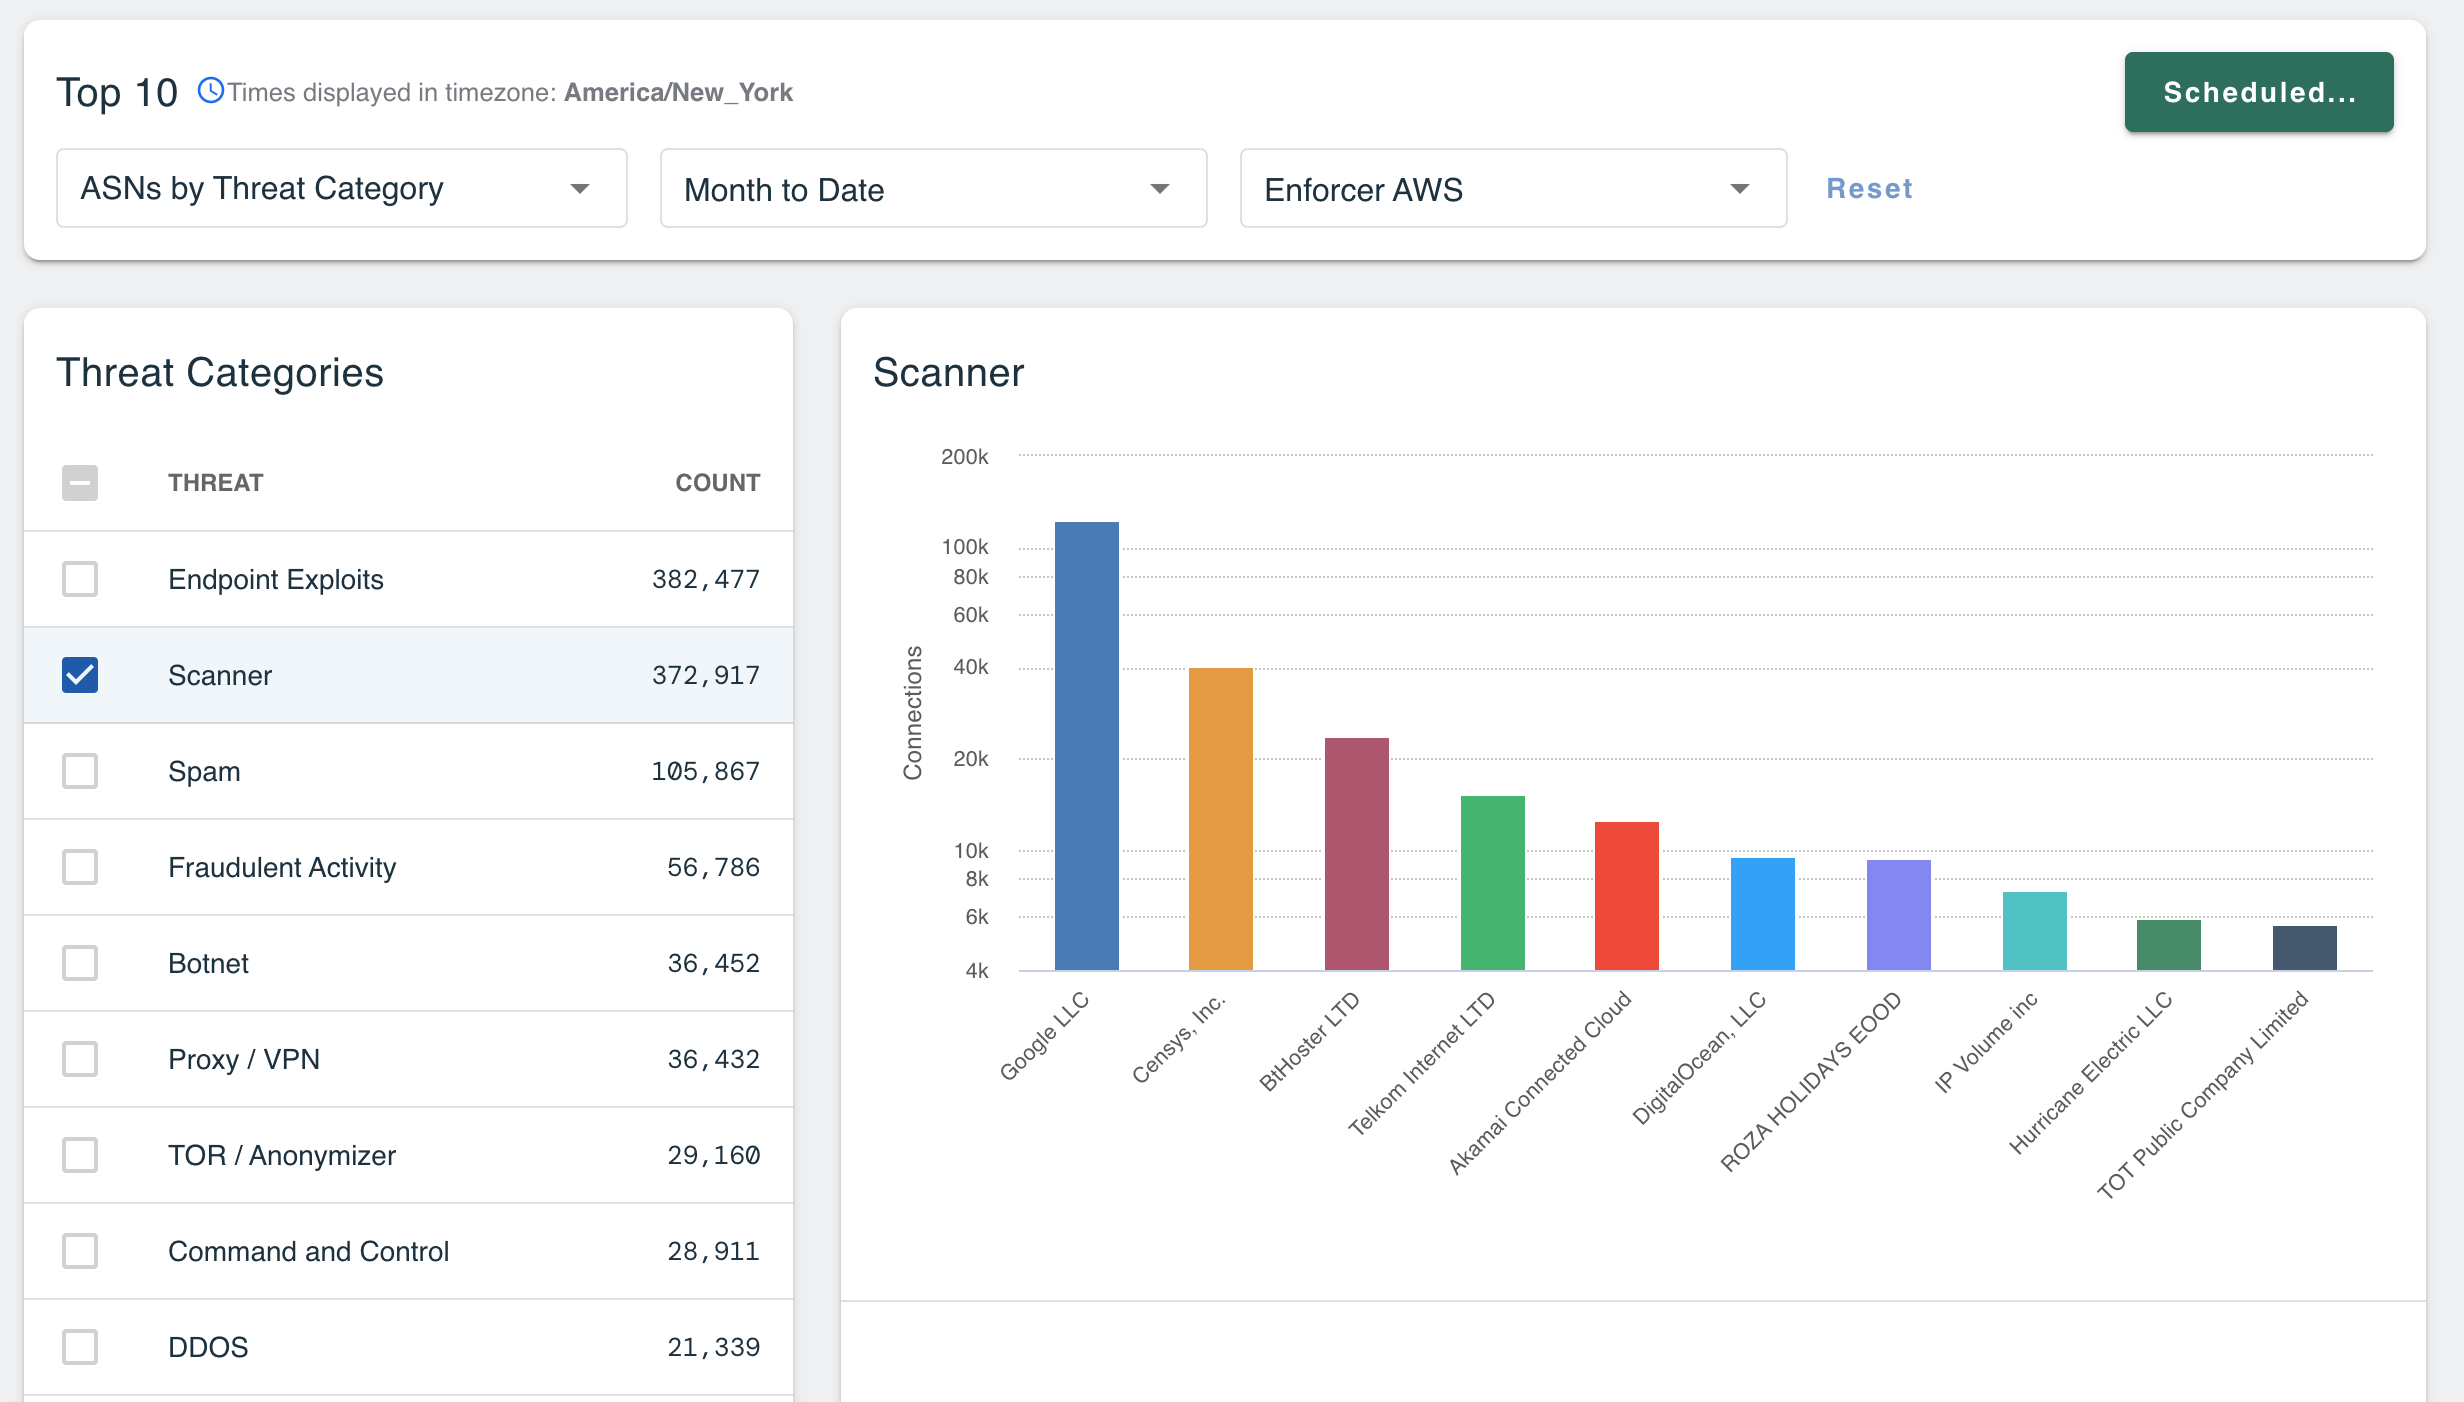
The Threat Category with the highest count will be selected by default and its graph will display in the right-hand panel. To view a graph for additional Threat Categories, select the desired category(s) in the left-hand panel.
Each threat category graph will display a bar for the top 10 ASNs with connections that have been flagged with that threat category. You can scroll over each bar to view the number of connections, based on the timeframe and Enforcer selected from the filters at the top of the screen.
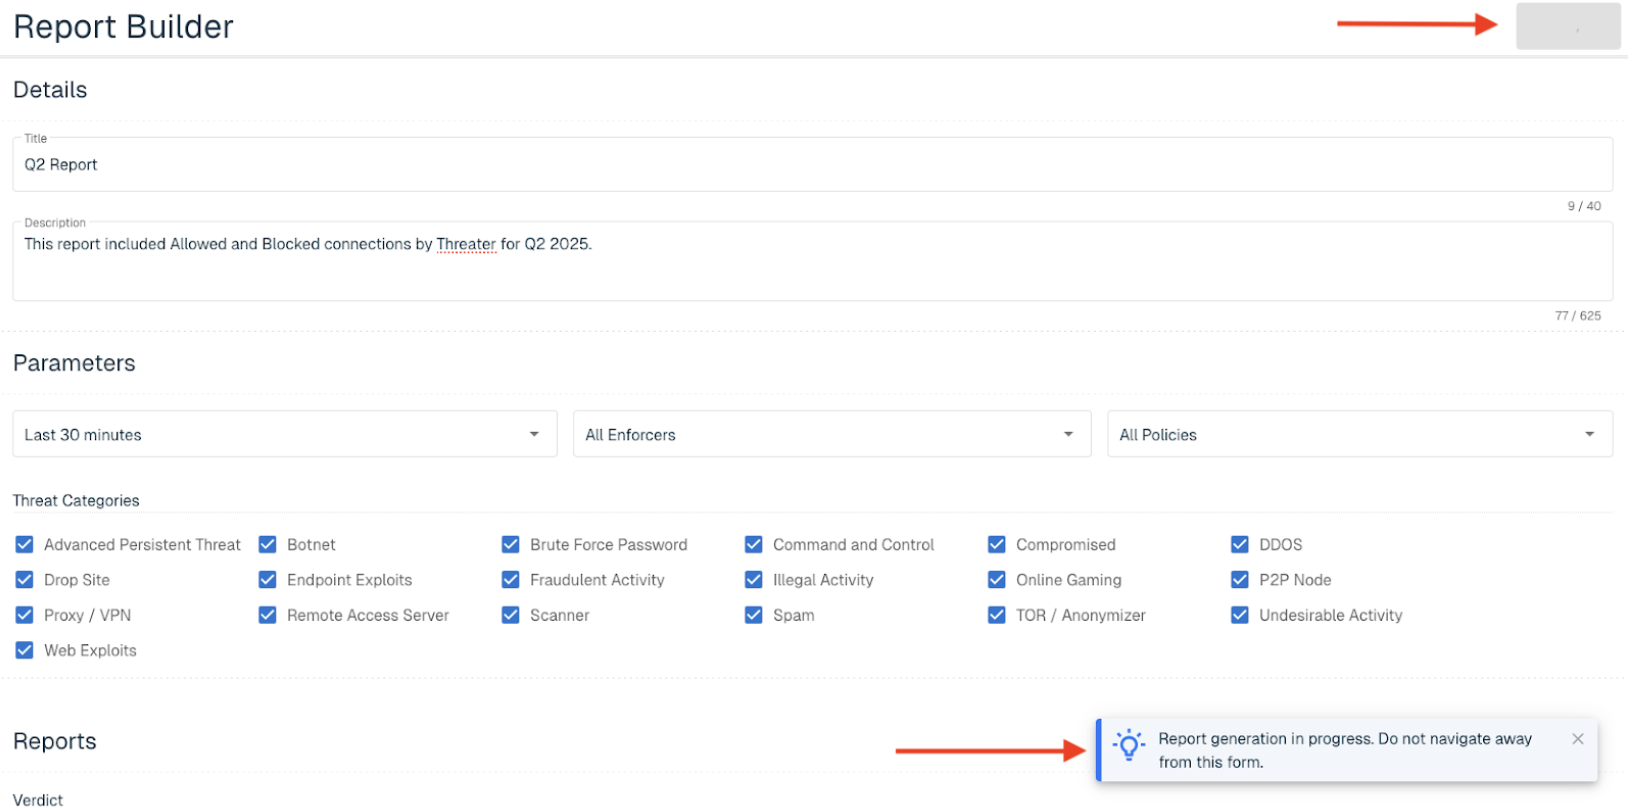
Report Builder
The Report Builder allows users to configure and generate PDF reports from the Portal. Access the Report Builder by going to Portal > Enforce > Reports and select Report Builder button.
The builder can be broken down in three sections:
Details
Provide the following details:
|
Field Name |
Description |
|
Title |
Unique report name |
|
Description |
Enter an optional description of the report |

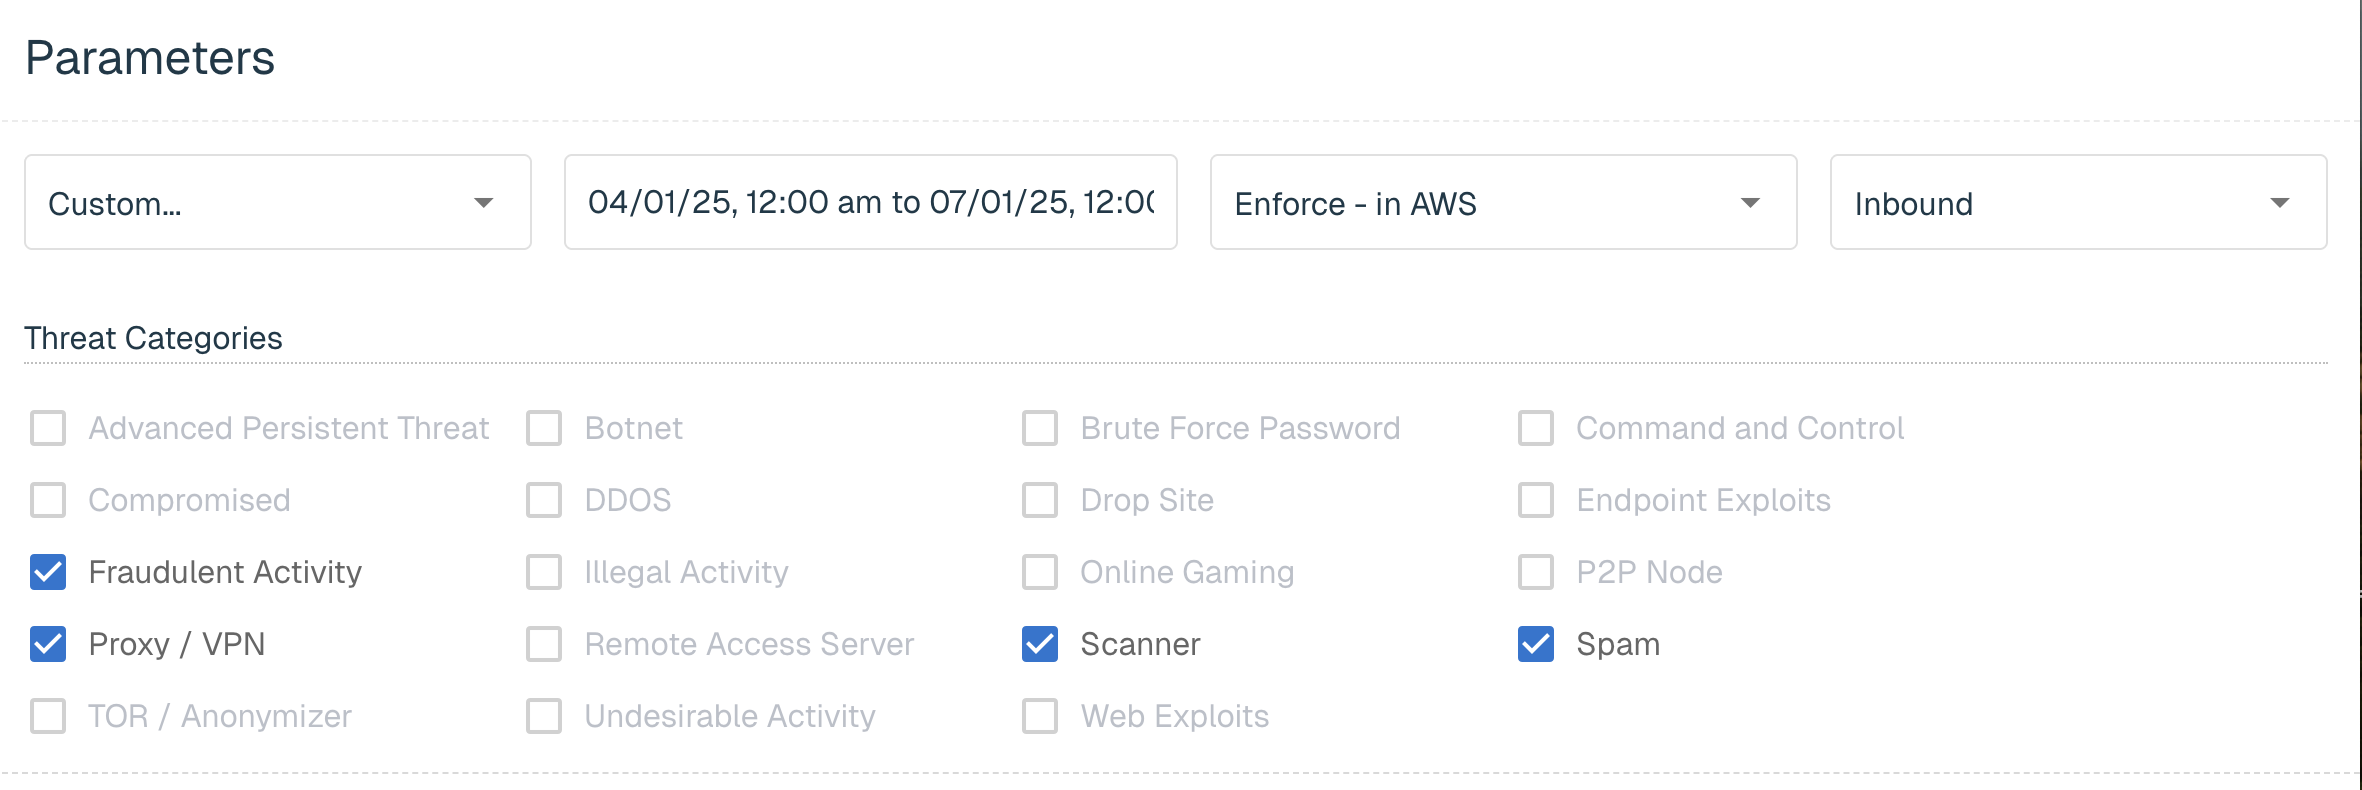
Parameters
The following global Report Parameters are available:
|
Field Name |
Description |
|
Timeframe |
Select one of the pre-set options in the drop-down or choose a custom time range |
|
Enforcers |
By default, a report can be generated for All Enforcers, or an individual Enforcer can be selected from the drop-down |
|
Policies |
By default, the report can display data from All Policies, or an individual Policy can be selected from the drop-down |
|
Threat Categories |
Users can select which Threat Categories to include in the applicable Threat reports |
The Report parameters selected will apply to each of the report sections made below.
Reports
The following verdict types are available to add to the master report:
|
Field Name |
Description |
|
Number of unique connections allowed or blocked by reason |
|
|
Categorized by the threat list(s) and is allowed or blocked based on the risk scores enabled at the policy level |
|
|
The top 10 countries that were allowed or blocked by total unique connections |
|
|
The top 10 ASNs that were allowed or blocked by total unique connections |
For each of these options, you can choose to include Allowed connections, Blocked connections, or both.
qa
The following Top 10 types are available to add to the master report:
|
Field Name |
Description |
|
Top 10 countries blocked due to specific threat category(s) |
|
|
Top 10 ASNs blocked due to specific threat category(s) |
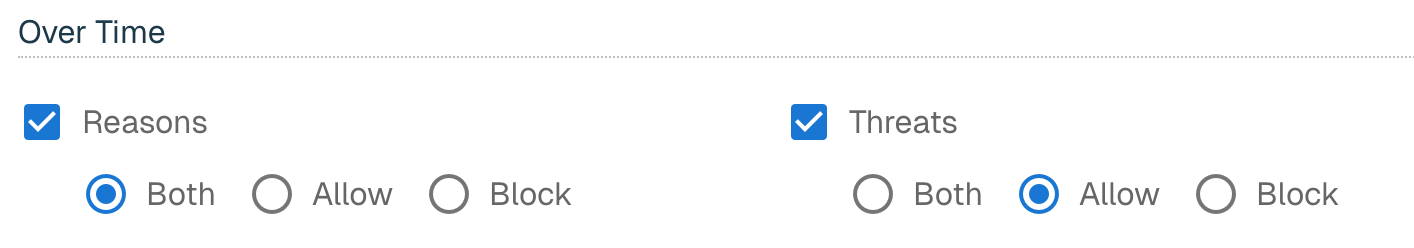
The following Over Time types are available to add to the master report:
|
Field Name |
Description |
|
Reasons |
Displays the "reasons connect detail" and trends over time |
|
Threats |
Display the "threats connect detail" and trends over time |
For each of these options, users can choose to include Allowed connections, Blocked connections, or both.
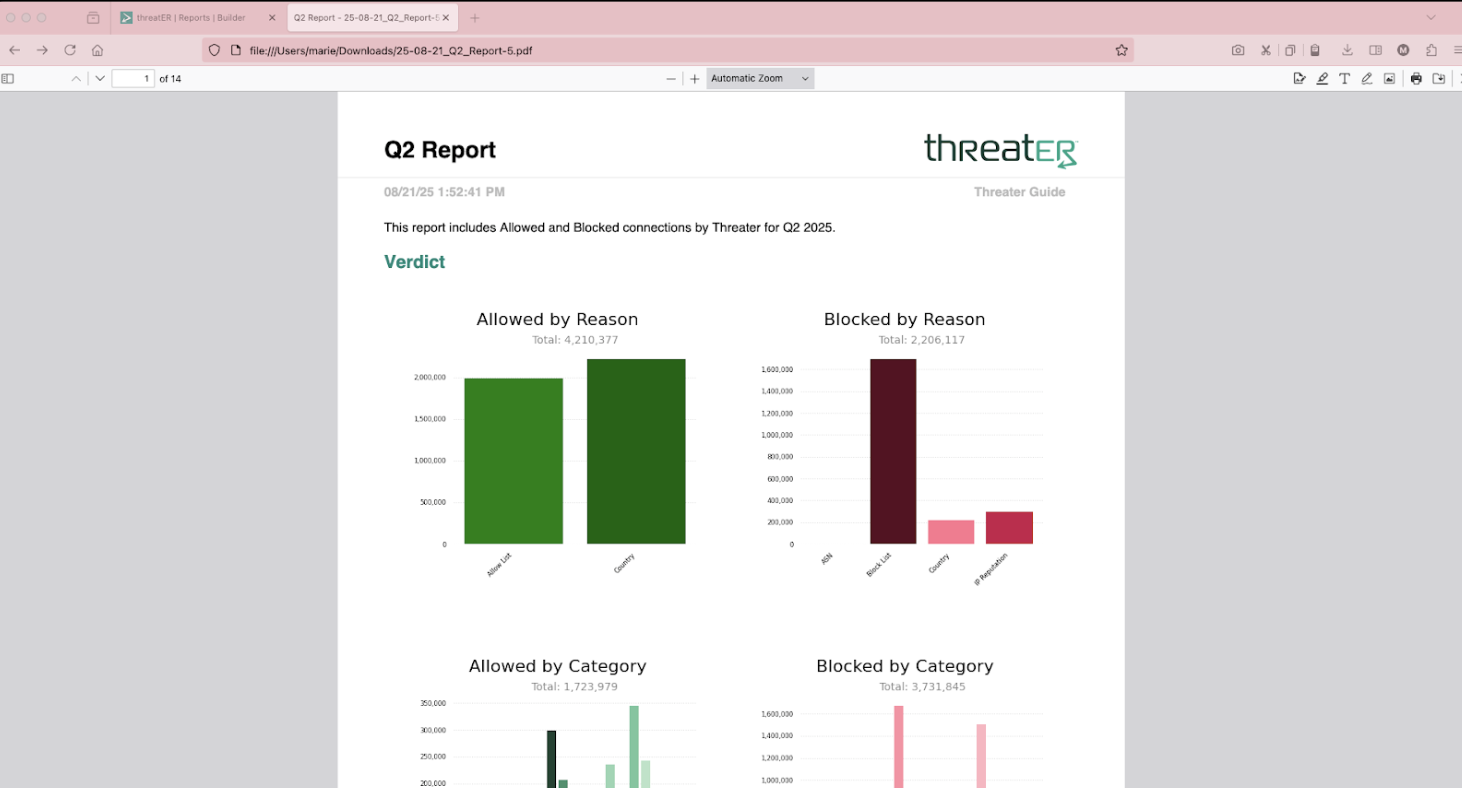
Once your selections are complete, click the Generate Report button in the top right corner. It may take several seconds for the PDF report to generate. The Generation button will not be active during this time and a prompt will display in the bottom right corner alerting you not to navigate away from the page.
Once it is ready, the document will open in a new tab and can be printed or downloaded to your local machine.
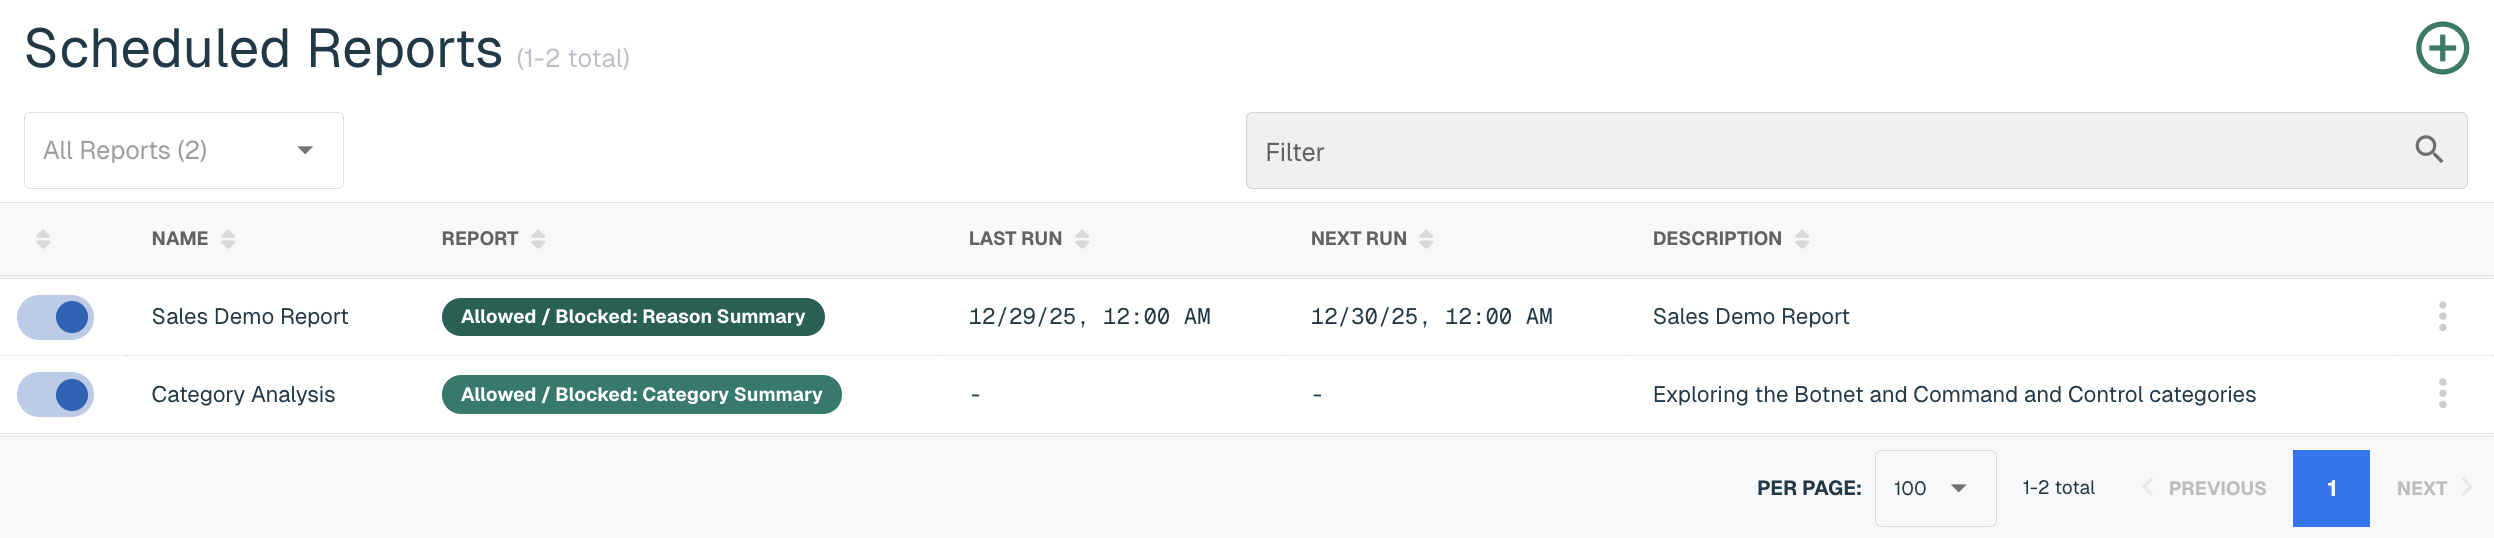
Scheduling Reports
Reports can be scheduled by selecting the Scheduled button and click the green ⊕ icon.
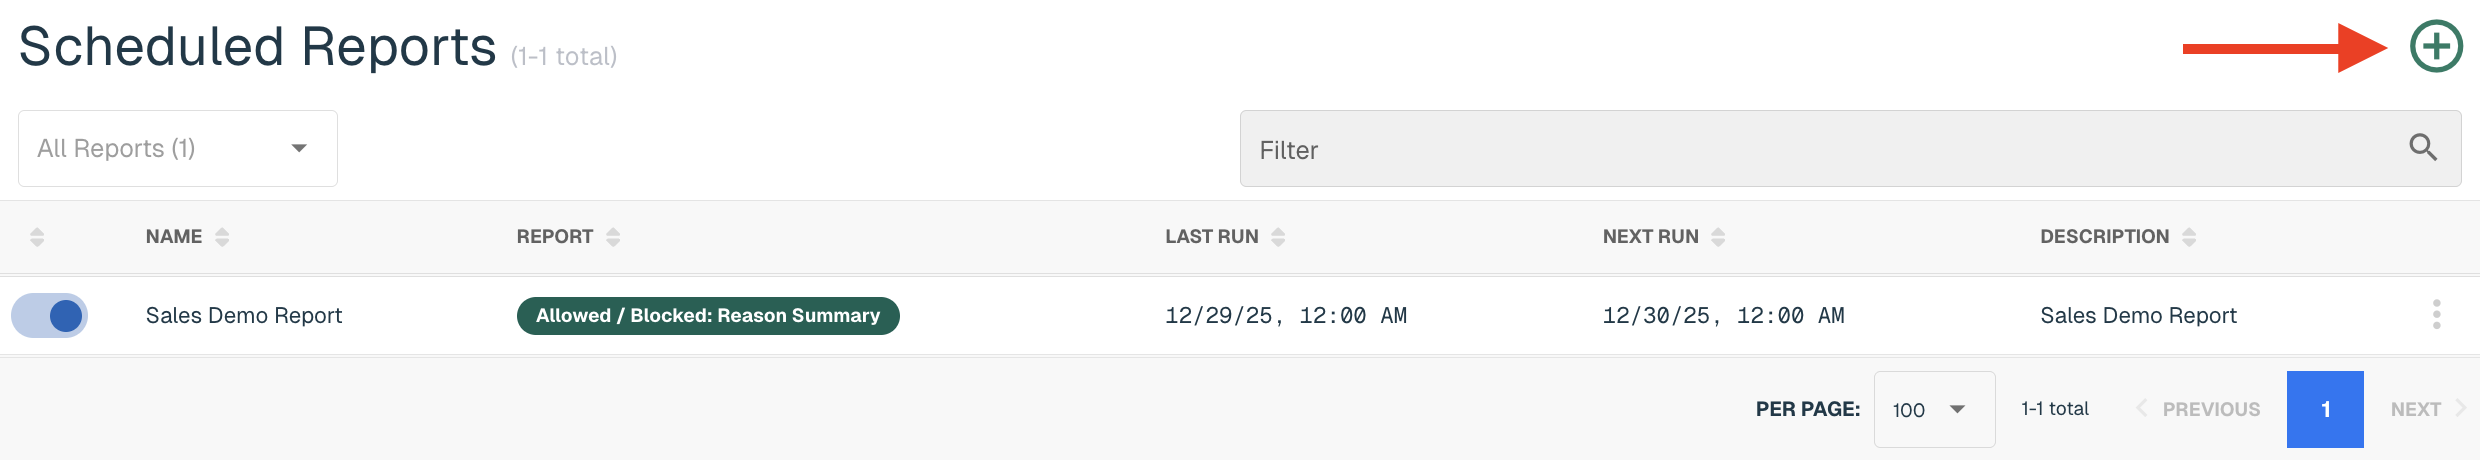
End users will be taken to the Scheduled Reports tab to create the report. Provide the following information in the Create Scheduled Report module (* indicates required field):
|
Field Name |
Description |
|
Enabled |
The default setting, keep the toggle to the right to enable the report |
|
Report* |
The type of report |
|
Name* |
The name of the report |
|
Delivery Email* |
The email of the individual that should receive the report |
|
Description |
Provide a brief summary of the report |
|
Policy (only available for Allow/Block reports) |
All Policies is the default selection. An individual policy can be selected from the drop-down. |
|
Threat Categories* (only available for Top 10 reports) |
Select the desired Threat Categories to include in the report |
|
Enforcer |
All Enforcers is the default selection. An individual can be selected from the drop-down. |
|
Preset* |
The date range of the report. Options include: Yesterday - report will run daily at midnight and includes data from the previous 24 hours Last Week - report will run weekly at midnight on Sunday and includes data from the previous week Last Month - report will run monthly at midnight on the 1st of each month and includes data from the previous month Last 7 days - report will run daily at midnight and includes data from the previous 7 days. |
|
Time Zone |
Preset to represent the local browser time zone |
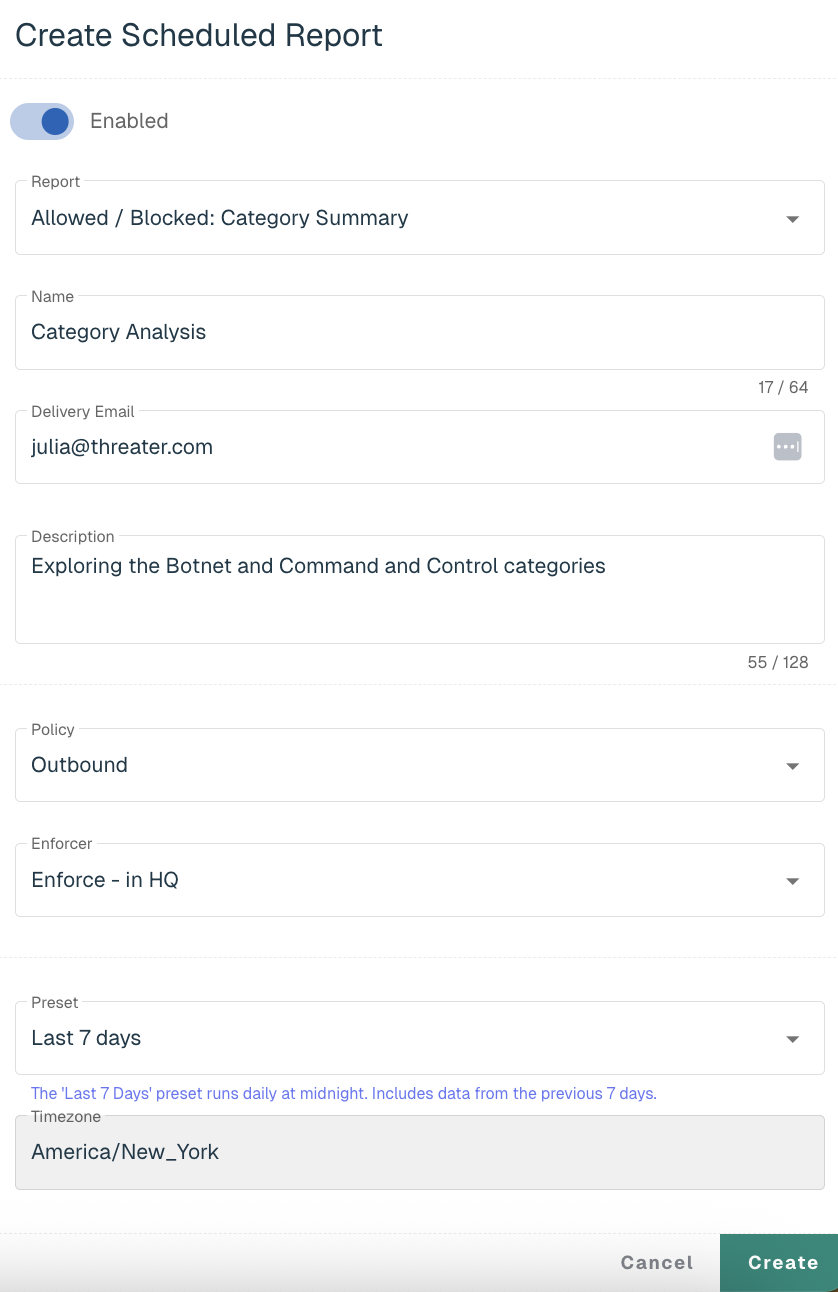
Select Create to finalize and save the report.
The list of scheduled reports will be available in the reports chart and can be narrowed down by report type.